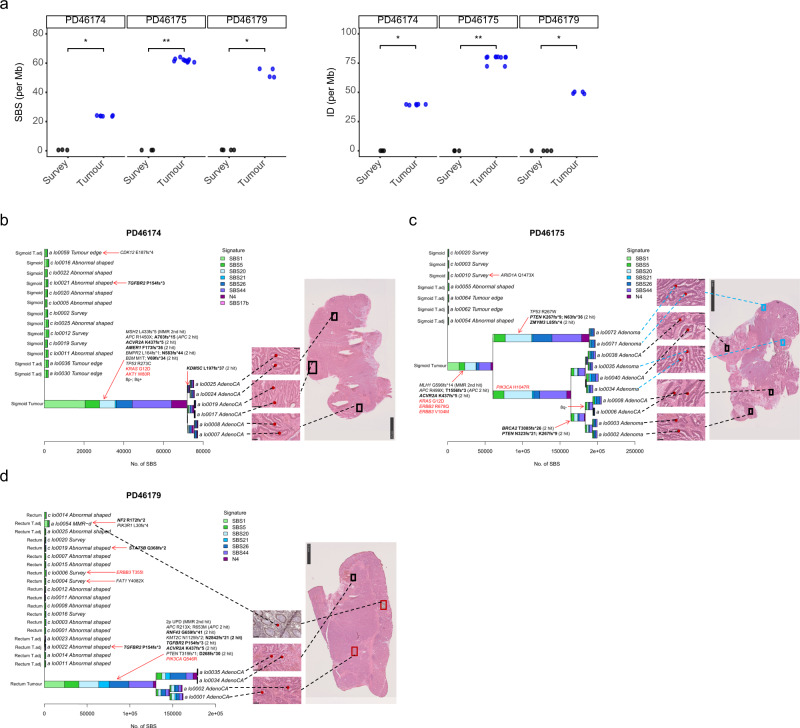
Fig. 4. SBS mutational signatures in the tumour crypts of LS patients.
a Single base substitutions (SBS) and insertions and deletions (ID) mutation density of tumour crypts (blue) compared to survey crypts (black) in the three patients with a paired colon tumour tissue. Two-sided Wilcoxon test: PD46174 (Survey: n = 3; Tumour: n = 6; p = 0.024), PD46175 (Survey: n = 3; Tumour: n = 10; p = 0.007), PD46179 (Survey: n = 4; Tumour: n = 4; p = 0.029) for both SBS and ID. b–d Phylogenetic trees showing the clonal relationship between crypts in the three patients with a paired tumour sample. Branch lengths correspond to the number of SBS mutations. SBS mutational signatures are mapped onto tree branches. Each crypt is annotated with its identifier, crypt type, and tissue origin. Cancer driver mutations and copy number variants are labelled on the corresponding tree branch. Frameshift mutations at microsatellite regions (repeat length ≥ 5) are indicated in bold. Activating mutations of oncogenes are indicated in red. Inactivating mutations of tumour suppressors are indicated in black. For tumour crypts, only the key cancer driver mutations on major tree branches are annotated. Most of the mutations in tumour crypts were frameshift mutations at microsatellite regions, which were consequences of MSI. These mutations were omitted from annotation. The location where each tumour crypt was sampled is shown by the H&E staining of the tumour section to the right of the phylogenetic trees. c For PD46175, adenoma crypts were annotated in blue brackets. d For PD46179, the inserts of the region within the red brackets show crypts that were sampled from another tissue section. These images of crypts were superimposed onto the tumour section to show its relative position. Scale bar of tumour section: 2.5 mm (PD46174 and PD46179); 5 mm (PD46175).

