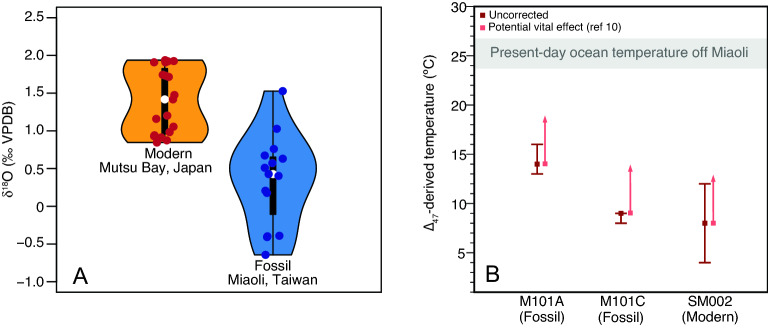
Figure 3.
(A) Violin plots illustrating the distribution of stable oxygen isotopic compositions and (B) temperature estimates derived from clumped isotopes of both fossil and modern specimens of S. mirabilis. The error bars in panel B indicate the uncertainty of the ∆47 temperature for each sample, calculated from the standard error of the measurement (1 sigma, n = 3) and then propagated through the temperature calibration. Due to the non-linearity of ∆47-temperature calibration and the fact that the error estimate is rounded up to the nearest whole number after being converted to temperature unit, the error bars may be asymmetric (e.g. M101A) or one of the error limits may overlap with the mean value (e.g. M101C). See Table S2 for ∆47 data and Methodology section for more detail on the calculation. The red arrows in panel B indicate potential vital effect (0.0146 ± 0.0042‰) as reported by Davies and John10, corresponding to ~ 4.5 °C of underestimation. The gray shaded bar indicates the present-day ocean temperature averaged over the upper 50 m water column off Miaoli based on the climatology data retrieved from the closest grid point in the World Ocean Atlas 2018 (Ref.14)at 24.5° N 120.5° E and the Ocean Data Bank (http://www.odb.ntu.edu.tw/) at 24.5° N 120.75° E (details in Supplementary Information).

