FIGURE 6.

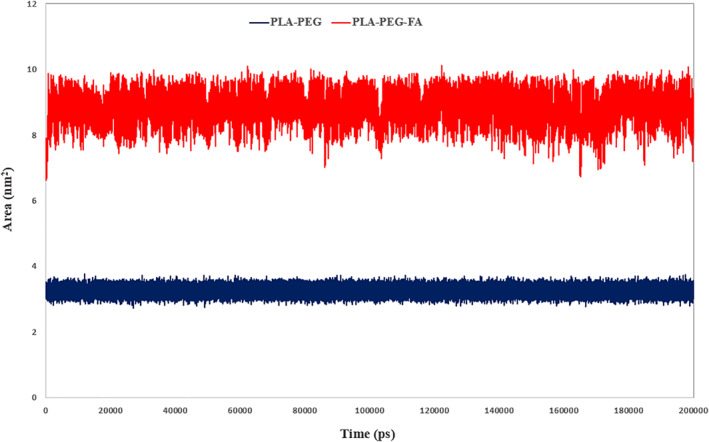
Schematic representation of solvent accessible surface area value for both systems, as can be seen, PLA–PEG‐FA has gained higher values

Schematic representation of solvent accessible surface area value for both systems, as can be seen, PLA–PEG‐FA has gained higher values