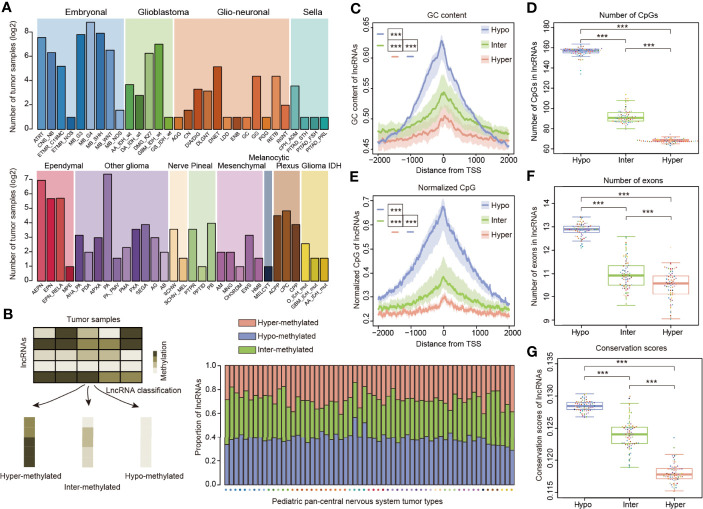
Figure 1.
LncRNA methylation patterns in pediatric pan-CNS tumors. (A) Number of tumor samples across different types of pediatric CNS tumors. The patients were classified into 12 major clusters with 61 sub-clusters. (B) Method to define the lncRNAs with different methylation patterns. The bar plots in the lower third show the proportion of lncRNAs with different methylation patterns across cancer types. (C) Distributions of GC content around the TSSs for lncRNAs with different methylation patterns. (D) Box plots showing the number of CpGs in lncRNA promoters with different methylation patterns. (E) Distributions of normalized CpG around the TSSs for lncRNAs with different methylation patterns. (F) Box plots showing the number of exons in lncRNAs for lncRNAs with different methylation patterns. (G) Box plots showing the average conservation scores in lncRNA promoters with different methylation patterns. *** indicates p < 0.001.

