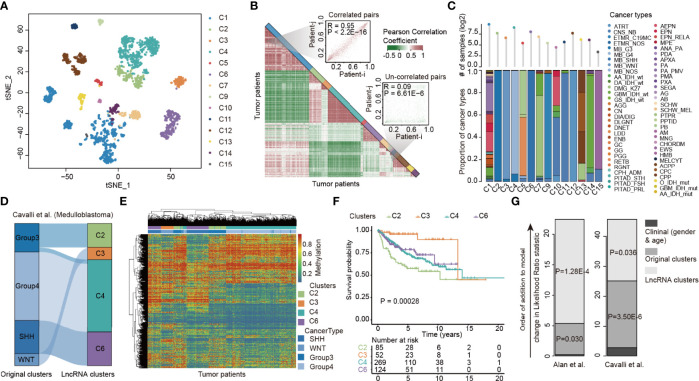
Figure 2.
LncRNA methylation heterogeneity in pediatric pan-CNS tumors. (A) Unsupervised clustering of tumor samples using tSNE dimensionality reduction. Individual samples are color-coded in the respective class color. (B) Heat maps showing the correlations of lncRNA methylation among tumor samples. Two representative examples were shown in the right side. (C) Bar plots showing the proportion of cancer types in each lncRNA methylation cluster. (D) Alluvial diagram of lncRNA methylation clusters in groups with different molecular subtypes. (E) Heat maps showing the methylation of lncRNAs in different clusters. (F) Kaplan–Meier curves of overall survival for patients with lncRNA methylation clusters. (G) The estimated log-likelihood ratio statistic of a Cox proportional hazards model. The change of LR statistic as features were added to the model was assessed for significance by Chi-square tests. Clinical clusters represent the Cox model constructed by gender and age. Original clusters represent the Cox model constructed by gender, age, and WHO category. LncRNA clusters represent the Cox model constructed by gender, age, WHO category, and lncRNA clusters.

