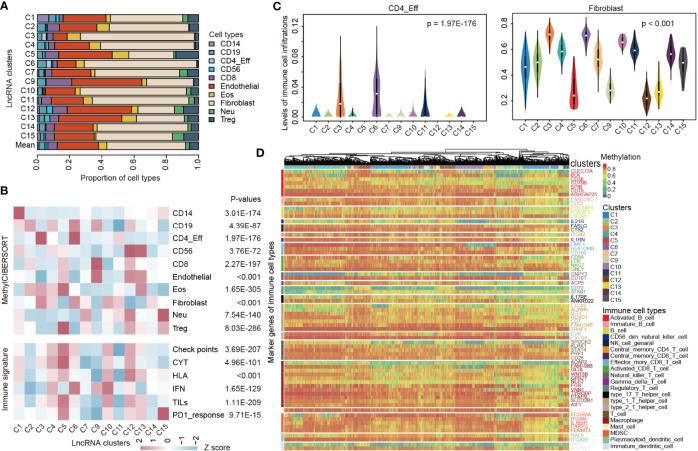
Figure 3.
TIME heterogeneity in pediatric pan-CNS tumors. (A) The proportions of immune cell-type infiltrations across lncRNA methylation clusters. (B) Heat maps showing the average immune cell infiltrations and immune signature scores across lncRNA methylation clusters. p-values were for ANOVA tests. (C) Violin plots showing the levels of immune cell infiltrations across lncRNA clusters. Left for CD4_Eff cells and right for fibroblast. (D) Heat maps showing the relative methylation of immune cell-type marker genes across patients in different lncRNA clusters. Genes were colored based on the immune cell types.

