Figure 4.
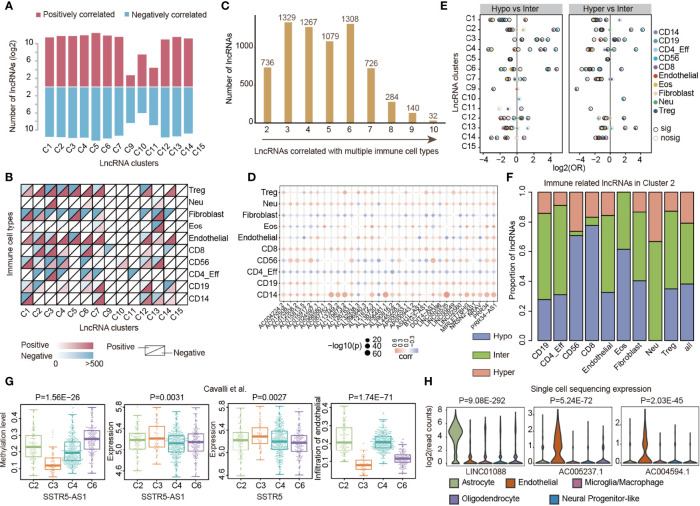
LncRNA methylations correlated with immune cell infiltrations in cancer. (A) Bar plots showing the number of lncRNAs in which methylation correlated with immune cell infiltrations across lncRNA clusters. Red for positively correlated lncRNAs and blue for negatively correlated lncRNAs. (B) Heat maps showing the number of lncRNAs in which methylation correlated with different types of immune cell infiltrations across lncRNA clusters. (C) Number of lncRNAs that correlated with different numbers of immune cell types. (D) Balloon plots of correlation between lncRNA methylation and immune cell infiltration. The colors of the balls represent the correlations and sizes represent the –log10(p-values). (E) Balloon plots showing the enrichment of lncRNAs with different methylation patterns. Balls were colored according to the immune cell types and significant enrichments were colored by dark black margins. (F) The proportion of lncRNAs correlated with immune cell infiltrations with different methylation patterns. (G) Box plots showing the distribution of methylation, expression, and infiltration of endothelial cells in different lncRNA clusters. (H) Violin plots showing the expression of lncRNAs in different immune cells based on single-cell sequencing data.

