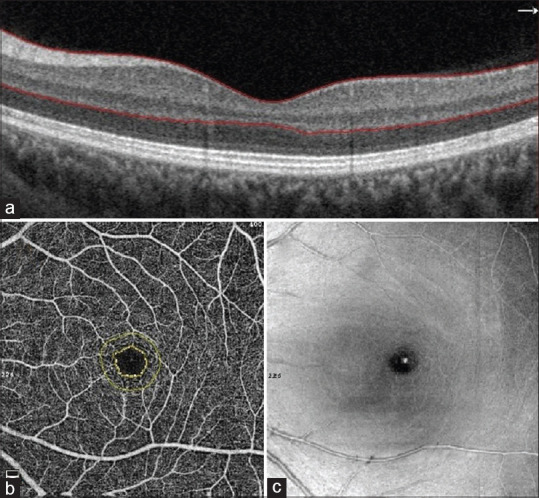
Figure 2.

Foveal avascular zone (FAZ) was evaluated in the region extending from internal limiting membrane (ILM) to outer plexiform layer (OPL) (red line to red line) (a) image of FAZ measurements (yellow lines) (b), C-scan (en-face) image of FAZ (c)
