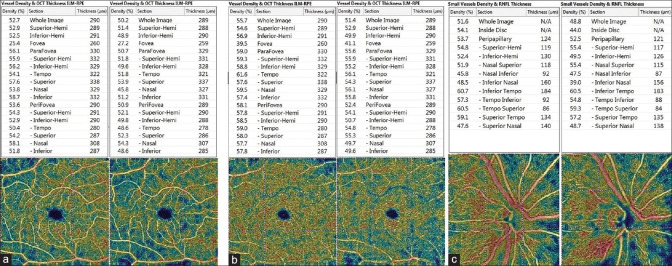
Figure 4.
Measurement of optical coherence tomography angiography parameters on a superficial (a), deep capillary plexus (b) and peripapillary region (c). Left columns represent vessel density parameters (top) and color map images of the patient (bottom) before caffeine intake. Right columns represent vessel density parameters (top) and color map images of the patient (bottom) after caffeine intake. Note the decrease of parameters related to caffeine intake

