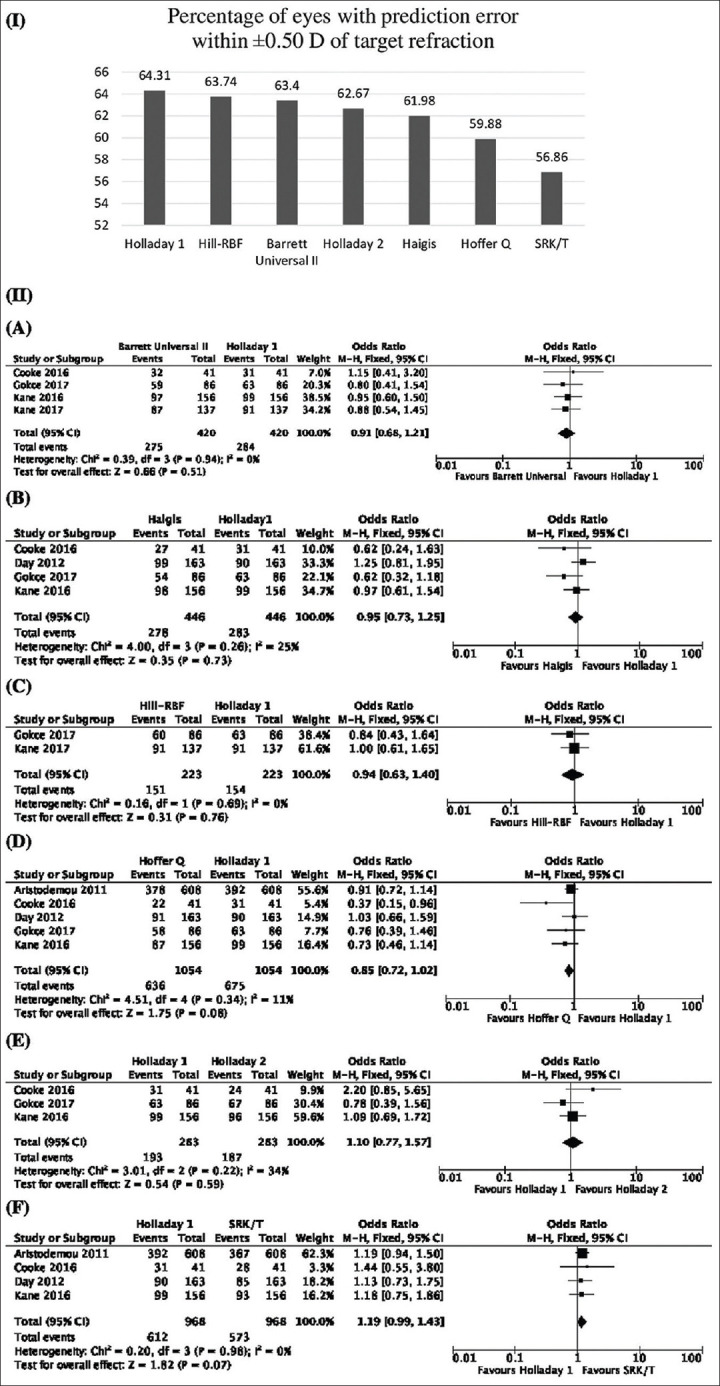
Figure 4.

(I) Percentage of eyes with prediction error within ±0.50 D of target refraction of all the formulae included in the analysis. (II) Forest plots showing comparison between Holladay 1 and Barrett Universal II (A), Haigis (B), Hill-RBF (C), Hoffer Q (D), Holladay 2 (E), and SRK/T (F). Abbreviations: D = Diopter; PE = Prediction error
