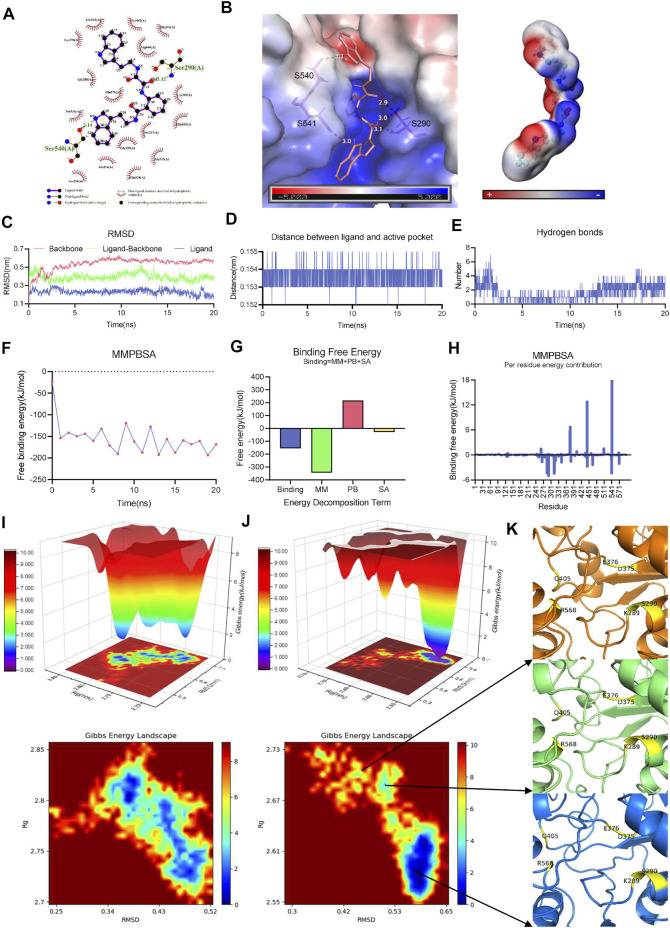
FIGURE 3.
Active pocket of PEDV NTPase is targeted by ZINC12899676 strongly, and its conformational change occurs. (A) Interactions between PEDV NTPase and ZINC12899676. Intermolecular hydrogen bonds are shown by green dashed lines with distance in Å. Non-ligand residues in hydrophobic contacts are shown by red gear. (B) Left: H-bond between PEDV NTPase and ZINC12899676 analyzed by Pymol and the electrostatic potential surface representation of PEDV NTPase in complex with ZINC12899676; right: electrostatic potential surface of ZINC12899676. (C) RMSD values of protein backbone, ligand-backbone, and ligand over the simulation time. (D) Distance between the ligand and active pocket of PEDV NTPase over the simulation time. (E) Number of H-bonds involved in the interaction between the protein and compound during the MD simulation. (F) Free binding energy of PEDV NTPase and ZINC12899676 calculated by MM-PBSA. (G) Energy decomposition of the binding energy calculated by MM-PBSA. (H) Decomposition of the energy per residue in the interaction between PEDV NTPase and ZINC12899676 calculated by MM-PBSA. The Gibbs energy landscape obtained during 20 ns MD simulation for (I) free PEDV NTPase and (J) PEDV NTPase-ZINC12899676 complex. (K) Conformation of the active pocket during different periods.

