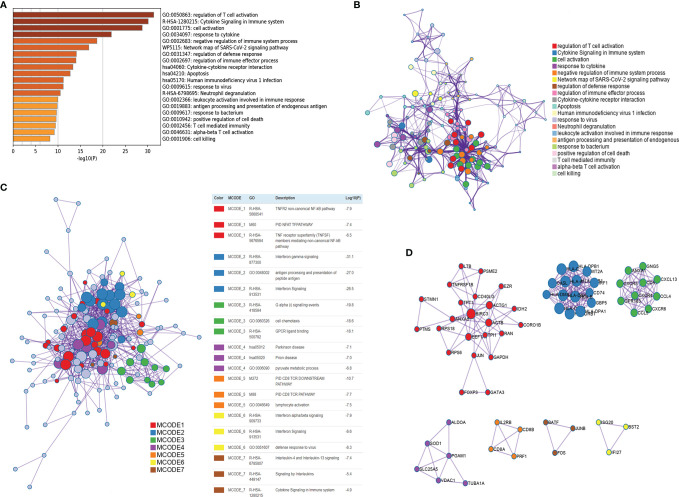
Figure 4.
Functional enrichment of CD4+ Tconv-related genes and visualization of interactome analysis results. (A) Metascape enrichment analysis for the CD4+ Tconv-related genes. (B) Metascape enrichment network visualization showing the intra-cluster and inter-cluster similarities of enriched terms. (C) Metascape visualization of the interactome network formed by CD4+ Tconv-related genes candidates, where the MCODE complexes are colored according to their identities. (D) Seven MCODE complexes automatically identified in Metascape, colored by their identities. Their functional labels are generated based on the top-three functional enriched terms.

