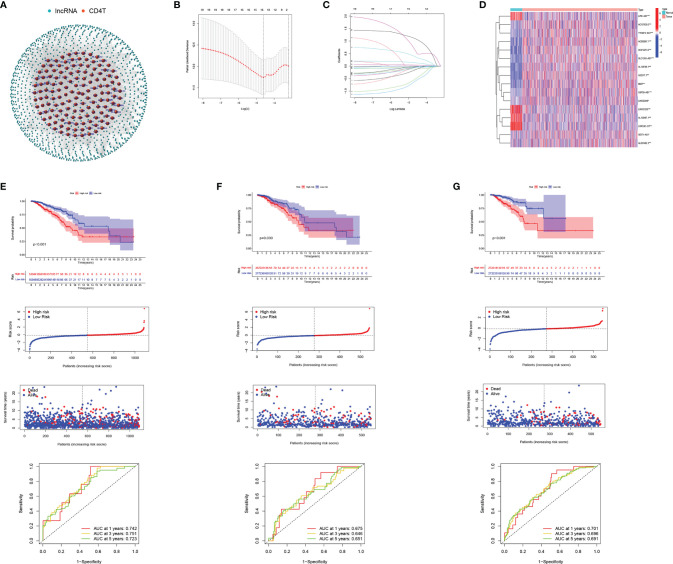
Figure 5.
Development and validation of CD4TLAs-Related Risk Signature. (A) Co-expression network of lncRNAs and CD4+ Tconv-related genes. (B) Cross‐validation for tuning parameter selection in the lasso regression. (C) Validation was performed for tuning parameter selection through the least absolute shrinkage and selection operator (LASSO) regression model for overall survival (OS). (D) The heatmap shows the expression distribution of A. (E) CD4TLAs-related prognostic model constructed in total BC patients. (F) Validation cohort 1. (G) Validation cohort 2. From top to bottom: Kaplan-Meier survival analysis of high- and low-RS subgroups; risk score between high- and low-risk groups; patient survival time; plots of the AUC for time-dependent ROC performance.

