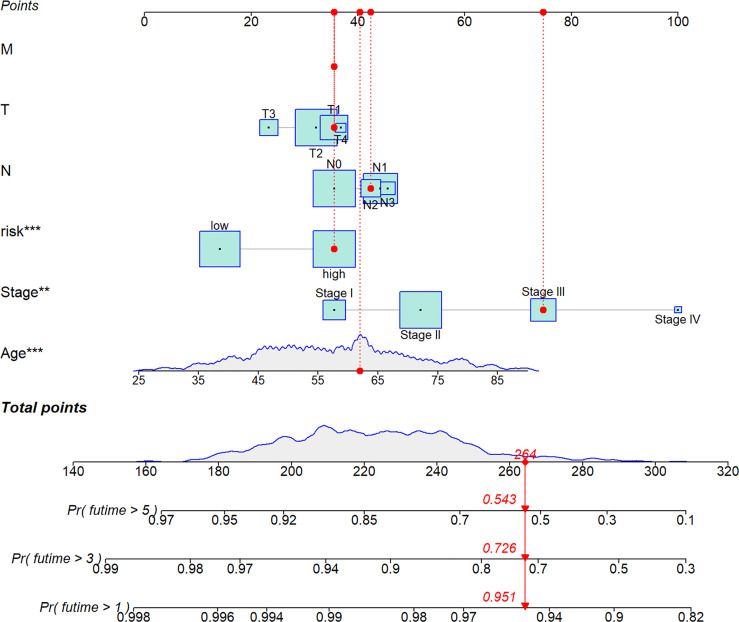
Figure 7.
A nomogram was established integrating the RS, Age, Stage, T, M, N, for predicting 1-, 3-, and 5-year survival outcomes of BC. To calculate survival probability, identify patient values on each axis and then for each draw a vertical line upward to the points axis. Add the points for all variables and locate this sum on the total points line. * P < 0.05, ** P < 0.01, and *** P < 0.001.

