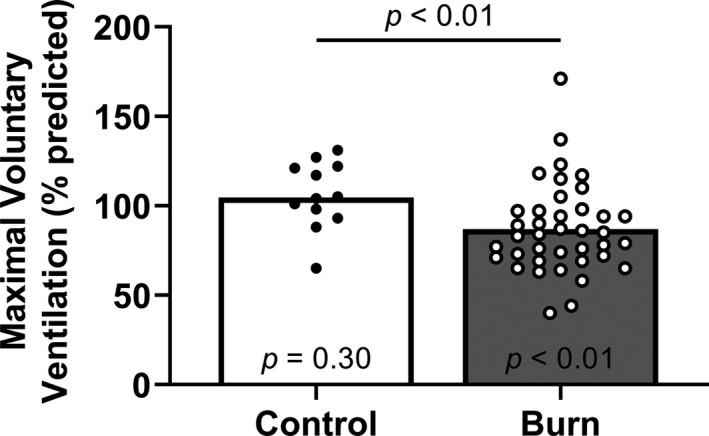
FIGURE 2.

Maximal voluntary ventilation. We compared group values using a Mann–Whitney test and present data as medians with individual values. We also compared the percent predicted maximal voluntary ventilation within each group using Wilcoxon signed‐rank tests (theoretical median of 100) and present the results within each bar. Control, control group of adults without a burn injury; Burn, adults with well‐healed burn injuries
