
FIGURE 3.
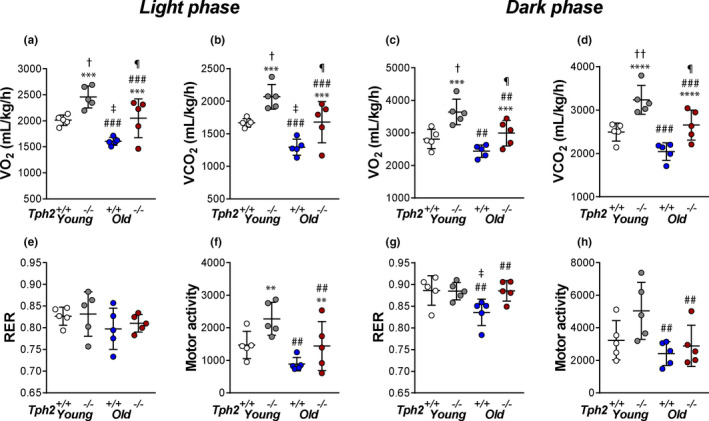
Individual and grouped data showing the age‐related differences between Tph2 −/− and Tph2 +/+ mice on total oxygen consumption (VO2) (a), total carbon dioxide production (VCO2) (b), respiratory exchange ratio (RER) (e), and total motor activity (f) in light cycle and VO2 (c), VCO2 (d), RER (g), and total motor activity (h) in dark cycle. Younger—Tph2 +/+ (n = 5), Tph2 −/− (n = 5); Older—Tph2 +/+ (n = 5), Tph2 −/− (n = 5). Tph, tryptophan hydroxylase. **p < 0.01, ***p < 0.001 and ****p < 0.0001—effect of genotype using two‐way ANOVA. ## p < 0.01 and ###p < 0.001 effect of age using Two‐way ANOVA. †p < 0.05 Tukey's post hoc test in comparison with Tph2 +/+younger mice. ‡p < 0.05 Tukey's post hoc test in comparison with Younger—Tph2 +/+. ¶p < 0.05 Tukey's post hoc test in comparison with Younger—Tph2 −/− and Older—Tph +/+