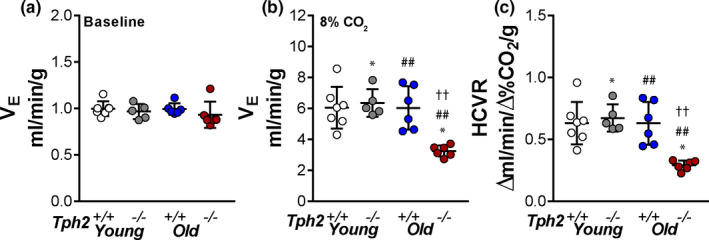
FIGURE 5.

Individual and grouped data showing the age‐related differences between Tph2 −/− and Tph2 +/+ mice one the baseline minute ventilation (V E) (a) V E at 8% of inspired CO2 (b) and hypercapnic ventilatory response (HCVR) (c). Younger—Tph2 +/+ (n = 7), Tph2 −/− (n = 5); Older – Tph2 +/+ (n = 6), Tph2 −/− (n = 6). Tph, tryptophan hydroxylase. *p < 0.05—effect of genotype using two‐way ANOVA. ##p < 0.01 effect of age using two‐way ANOVA. ‡‡p < 0.01 Tukey's post hoc test in comparison with younger Tph2 +/+ mice and older Tph2 −/ mice
