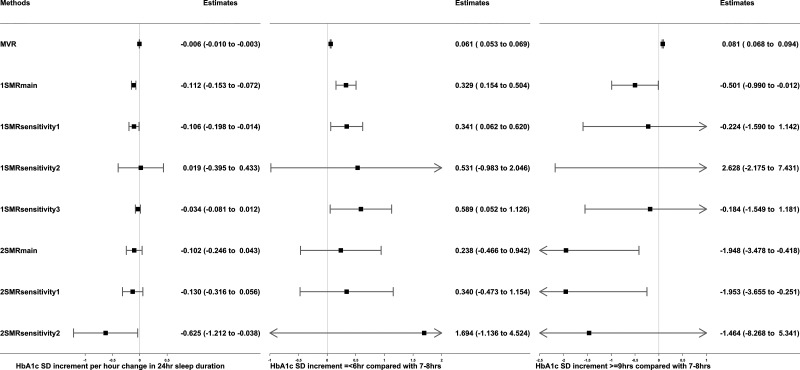
Figure 2.
Associations of sleep duration traits (24-h sleep duration, short sleep duration, and long sleep duration) with HbA1c in observational MVR analysis, 1SMR in the UKB, and 2SMR in MAGIC. Data are SD increment (95% CI) in HbA1c in relation to differences in sleep duration traits (per hour increase in sleep duration, sleep duration ≤6 vs. 7–8 h, sleep duration ≥9 vs. 7–8 h). MVR was adjusted for sex, age, assessment center, 40 genetic principal components, smoking, alcohol intake, Townsend deprivation, education, sleep apnea, and physical activity. 1SMRmain, 1SMRsensitivity1, 1SMRsensitivity2, and 1SMRsensitivity3 were equivalent to two-stage least square, inverse variance–weighted (IVW), MR-Egger, and least absolute deviations regression in 1SMR, respectively. 2SMRmain, 2SMRsensitivity1, and 2SMRsensitivity2 were equivalent to IVW, weighted median, and MR-Egger regression in 2SMR, respectively. 1-SD HbA1c in the UKB is 0.15 log mmol/mol; 1-SD HbA1c in MAGIC is 0.53% (∼6 mmol/mol).

