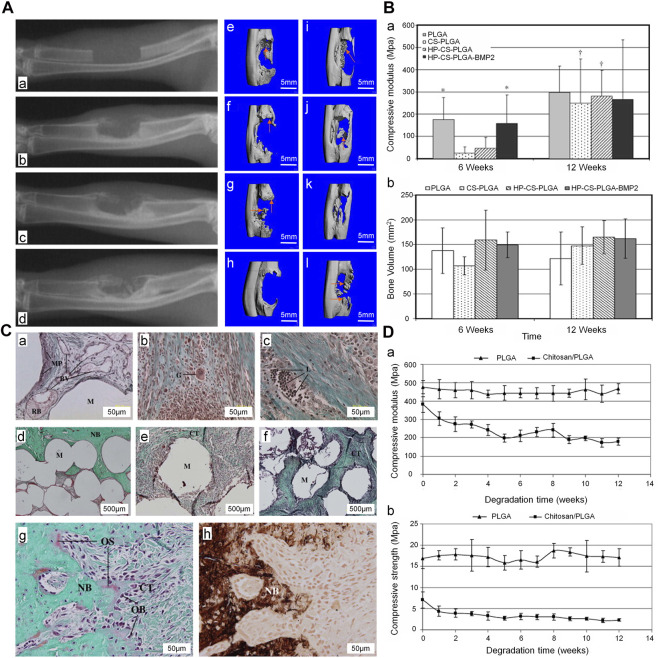
FIGURE 6.
Treatment of ulna defect with CS/PLGA sintered microspheres (Jiang et al., 2010). (A) The X-ray images of the ulna defect (a), X-ray (b, c, d) at 4, 8, and 12 weeks after implantation in the HP-CS-PLGA-BMP2 group. Three-dimensional CT, (e–h) and (i–l) at 6 and 12 weeks after implantation in the PLGA, CS-PLGA, HP-CS-PLGA, and HP-CS-PLGA-BMP2 groups, respectively. (B) (a) Compressive modulus (b) and bone volume at 6 and 12 weeks after implantation (*p < 0.1). (C) Masson’s trichrome staining performed (a) at 6 weeks after implantation in the PLGA group and (b, c) at 6 and 12 weeks after implantation in the HP-CS-PLGA group. Masson’s trichrome staining (d–f) performed at 12 weeks after implantation in the PLGA, HP-CS-PLGA, and HP-CS-PLGA-BMP2 groups. Masson’s trichrome (g) and von Kossa staining of HP-CS-PLGA performed at 12 weeks after implantation at 50 μm. (D) Compressive modulus (a) and compressive strength (b) analysis (p < 0.05). BMP2, bone morphogenetic protein 2; CS, chitosan; CT, computed tomography; HP, heparin; PLGA, and poly (lactic-co-glycolic acid).

