Figure 1.
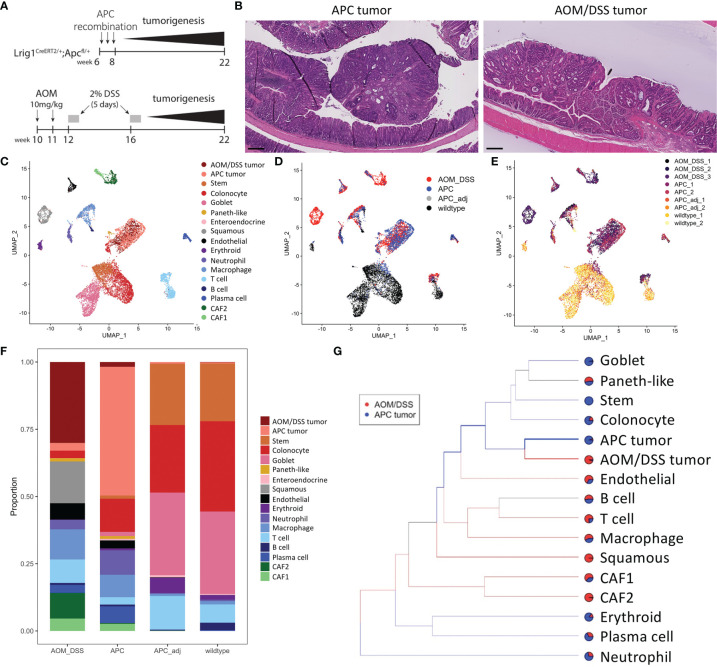
Cell type composition of wildtype, APC tumor, APC adjacent normal, and AOM/DSS tumor samples assessed by scRNA-seq. (A) Experimental timeline for induction of APC tumors (top) and AOM/DSS tumors (bottom). (B) Representative H&E images of APC tumors and AOM/DSS tumors. Scale bars = 300 µm. UMAP co-embedding of wildtype, APC tumor, APC adjacent normal, and AOM/DSS tumor scRNA-seq samples with (C) cell type clustering overlay, (D) sample type overlay, and (E) replicate overlay, by color. (F) Bar graph of cell type proportions, broken down by sample type in scRNA-seq data. (G) sc-Unifrac analysis of APC tumor sample cell types compared to AOM/DSS tumor sample cell types from scRNA-seq data. Colored branches indicate statistically enriched cell population structures per sample type, with black branches indicating non-significance. Pie charts indicate the proportional representation between the two sample types. Thickness of branches represent level of enrichment sc-Unifrac distance values range from 0 to 1, with 0 representing complete overlap between two datasets sc-Unifrac distance = 0.35.

