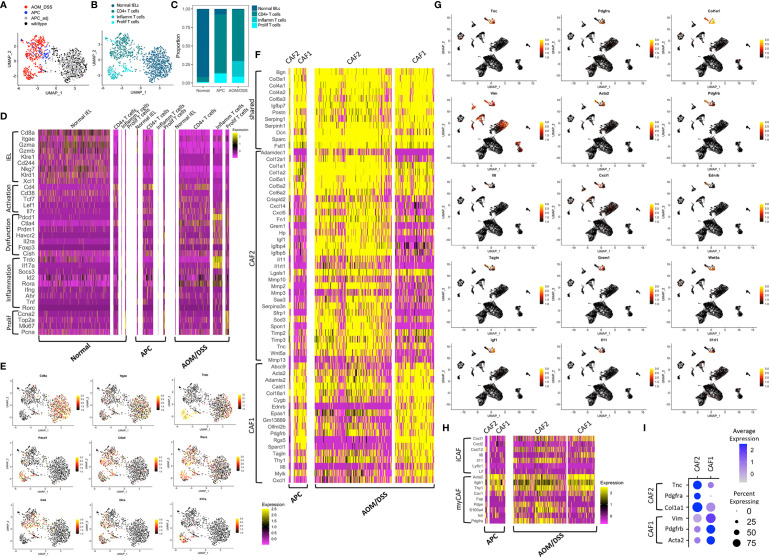
Figure 2.
Transcriptomic differences among microenvironmental cell types in normal colonic, APC tumor, and AOM/DSS tumor samples. UMAP co-embedding of the T cell cluster from wildtype, APC tumor, APC adjacent normal, and AOM/DSS tumor scRNA-seq samples with (A) sample type overlay (B) and cell type clustering overlay, by color. (C) Bar graph of T cell type proportions, broken down by subcluster and sample type in scRNA-seq data. (D) Heatmap of select T cell subtype marker expression in scRNA-seq data within the T cell clusters, split by sample type. Columns represent single cells. (E) UMAPs of scRNA-seq data with gene expression overlay, indicated by the color gradient, for select T cell subtype markers. (F) Heatmap of DEGs in fibroblast subtypes (CAF1, CAF2) in scRNA-seq data, split by fibroblast subtype and by sample type. Columns represent single cells. (G) UMAPs of scRNA-seq data with gene expression overlay, indicated by the color gradient, for select fibroblast subtype markers. (H) Heatmap of expression of markers of iCAFs and myCAFs described in literature in CAF1 and CAF2 populations in scRNA-seq data, broken down by tumor sample. Columns represent single cells. (I) Dot plot showing selected markers for fibroblast subtypes, CAF1 and CAF2, where clusters include cells from both APC tumor and AOM/DSS tumor samples.

