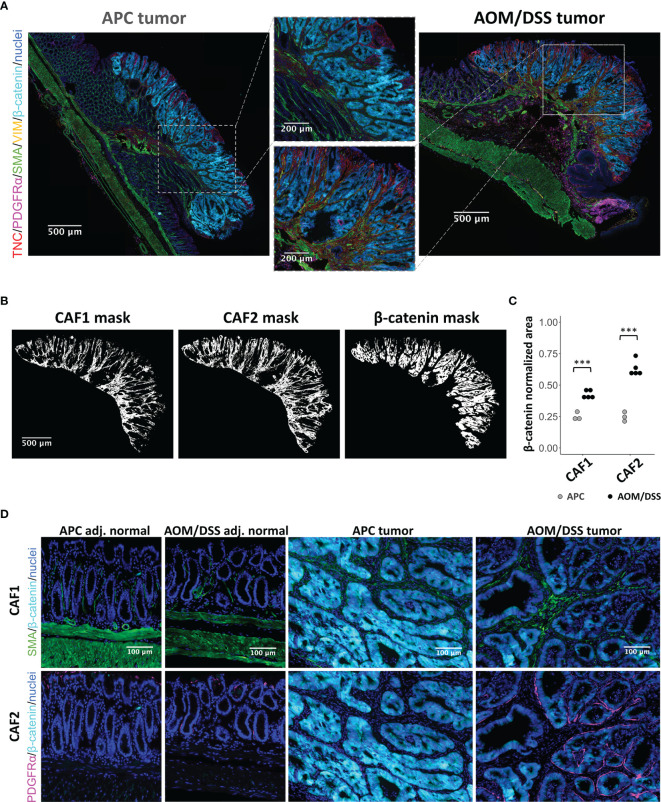
Figure 3.
MxIF of cancer-associated fibroblasts to reveal their spatial distributions in APC and AOM/DSS tumors. (A) Representative stitched MxIF images of APC tumors and AOM/DSS tumors immunostained for CAF1 (SMA, VIM) and CAF2 (TNC, PDGFRα) subtypes. Tumor regions are visualized using immunostaining for β-catenin. (B) Representative binary images (here, AOM/DSS tumor sample) and (C) quantification of CAF1 and CAF2 marker expression within tumor regions of APC and AOM/DSS samples. n = 5 AOM/DSS tumors, n = 3 APC tumors *** indicates p < 0.001. (D) Visualization of CAF1 (SMA) and CAF2 (PDGFRα) subtype proximity to β-catenin+ tumor cells in APC and AOM/DSS samples, including tumor regions and adjacent normal regions.

