Figure 4.
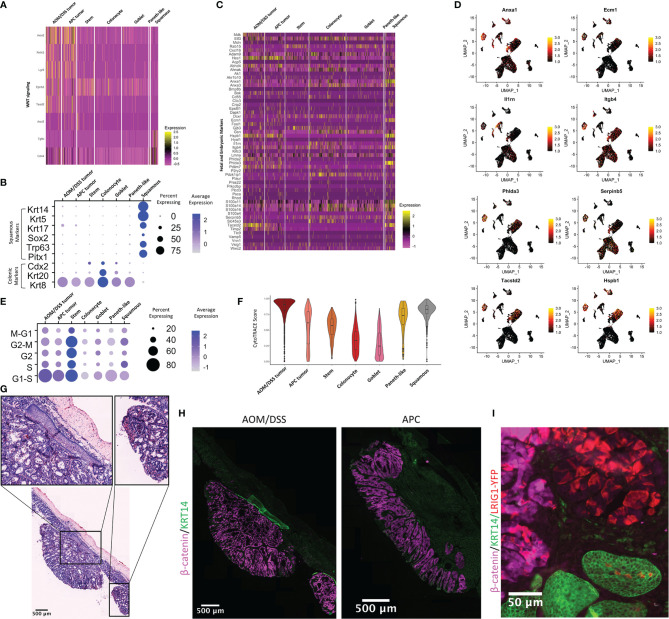
Characterization of the squamous component present in AOM/DSS, but not APC, tumors. (A) Heatmap of genes related to WNT signaling and colonic stem cells. Columns represent single cells, arranged by epithelial cell type clusters. (B) Dot plot showing colonic or squamous identity genes for epithelial cell clusters, where clusters include cells from both APC tumor and AOM/DSS tumor samples. (C) Heatmap of fetal and embryonic programs. Columns represent single cells, arranged by epithelial cell type clusters. (D) UMAPs of scRNA-seq data with expression overlay, indicated by the color gradient, of selected fetal and embryonic genes. (E) Dot plot showing cell cycle meta-genes for each cell cycle phase in epithelial cell clusters. (F) CytoTRACE scores for epithelial cell types calculated from scRNA-seq data. (G) Representative H&E image of multiple AOM/DSS tumors within the same animals, with a focus on squamous components (insets). (H) Representative MxIF image of KRT14 in APC tumors and AOM/DSS tumors. Images were representative of n = 5 AOM/DSS tumors and n = 3 APC tumors. (I) Observation of Lrig1CreERTe/+;RosaYFP/+ traced cells within a single squamous cell region of an AOM/DSS tumor.

