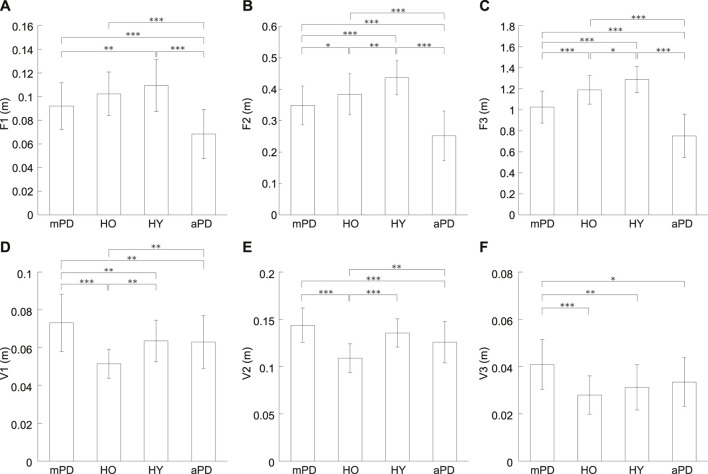
FIGURE 3.
Averages of the forward and vertical displacements. (A) F1, (B) F2, (C) F3, (D) V1, (E) V2, and (F) V3. mPD, HO, HY, and aPD represent mild PD patients, healthy older individuals, healthy young individuals, and advanced PD patients, respectively. The error bars indicate the standard deviations between the participants. *, **, and *** represent p < 0.05, p < 0.01, and p < 0.001, respectively.

