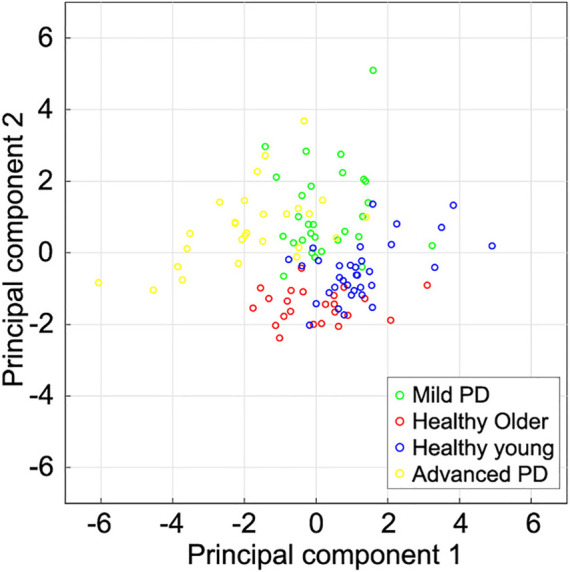
FIGURE 5.

Scatter plot of the first two principal components extracted from subjects’ spatial gait features. The first and second component magnitudes represent the displacements of the foot trajectories in the forward and vertical directions, respectively. Healthy young individuals tended to have a larger first principal component than other subjects. The first principal component of mild PD patients and healthy older individuals is larger than that of advanced PD patients. The second principal component of healthy older individuals tends to be smaller than that of the other subjects.
