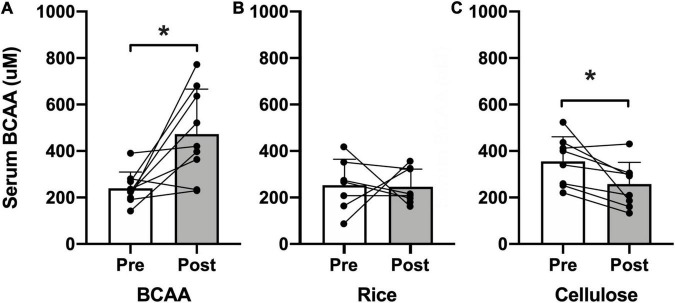
FIGURE 2.
Serum BCAA concentration. Pre- (open bars) and post-intervention (shaded bars) serum BCAA concentration (μM) for the (A) BCAA, (B) rice protein, and (C) microcrystalline cellulose groups (mean ± standard deviation). Individual data points with connecting lines overlaid. *p < 0.05, paired two-tail t-test.

