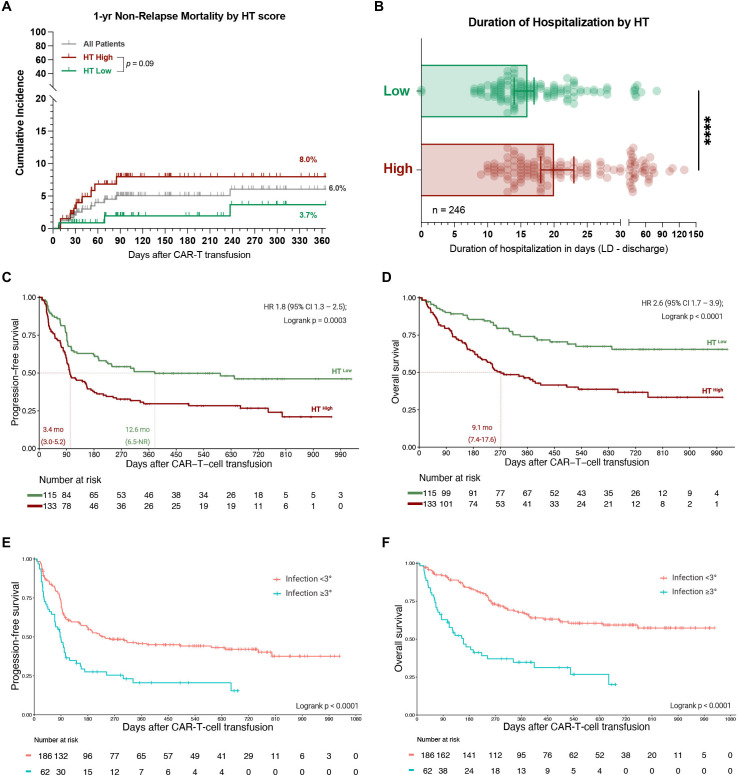
Figure 5.
Patients with a high HT score and with severe infectious complications display poor survival outcomes. (A) 1-year non-relapse mortality (NRM) across all patients (gray) and in HThigh (red) vs HTlow (green) patients. The p value of the Mantel-Cox log-rank test comparing HThigh vs HTlow patients is depicted. (B) Median duration of hospitalization from the time point of lymphodepletion until the day of first discharge or death by HT score (data available for 246 patients). Statistical significance was determined by Mann-Whitney test. (C, D) Kaplan-Meier estimates of progression-free (C) and overall survival (D) by HT score. The median PFS and OS in months for HThigh (red) vs HTlow (green) patients is depicted on the lower left graph inset with the respective 95% CI. The HR with the 95% CI comparing HThigh (test) vs HThigh (comparator) in a univariate Cox regression model is depicted together with the p value of the log-rank test on the upper right graph inset. (E, F) Kaplan-Meier estimates of PFS (E) and OS (F) comparing patients with grade ≥3 infections (blue) to patients with grade <3 infections (orange). The p value of the log-rank test is depicted on the graph inset. OS, overall survival; PFS, progression-free survival; HT, CAR-HEMATOTOX.

