Figure 5.
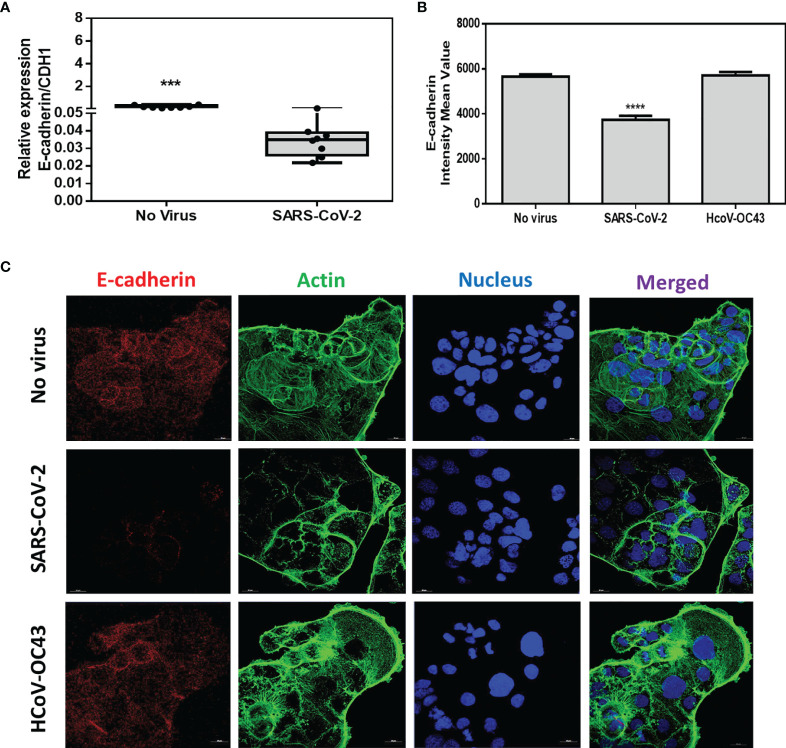
Expression of CDH1/E-cad mRNA and E-cad protein. (A) Expression of CDH1/E-cad mRNA in virus-free Caco-2 cells or cells exposed to SARS-CoV-2 at an MOI of 0.5 for 24 hours. The results (n=8) are expressed as RE where RE = 2(−ΔCT).The symbol *** means a p-value < 0.001. (B) Quantitative representation of mean fluorescence intensity (n=4) corresponding to E-cad protein expression on Caco-2 cells infected or not with SARS-CoV-2 or HCoV-OC43. The symbol the symbol ****means a p-value < 0.0001. (C) Illustration of single plane confocal microscope analysis of E-cad expression on subconfluent virus-free Caco-2 cells or cells exposed to coronaviruses SARS-CoV-2 or HCoV-43 at an MOI of 0.5 for 24 hours. The analysis was performed on cells permeabilized with 0.1% Triton X-100. Actin expression was shown as control as well as the labeling of the nucleus.

