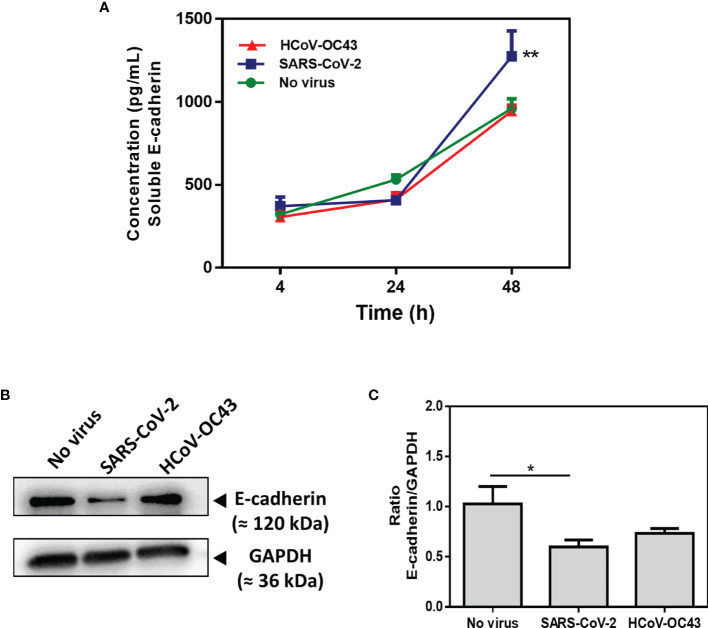
Figure 6.
Expression of E-cad and sE-cad. in Caco-2 cells. (A) Quantification of sE-cad (n=4) in the cell-culture supernatant of virus-free Caco-2 cells and cells exposed to coronaviruses SARS-CoV-2 or HCoV-OC43 at an MOI of 0.5 for 4 hours, 24 hours and 48 hours respectively, using antigen-specific ELISA. The results are the average of quadruplicates. (B) Western blot analysis of E-cad expression in virus-free Caco-2 cells and cells exposed for 48h to SARS-CoV-2 or HCoV-OC43 coronaviruses. GAPDH was used as loading control. (C) Quantitative representation of E-cad protein expression by Caco-2 cells infected or not with SARS-CoV-2 or HCoV-OC43 normalized with respect to GAPDH. The Image J program was used to quantify the Western blot bands intensity. The symbol ** means a p-value < 0.01. The symbol * means a p-value < 0.05.

