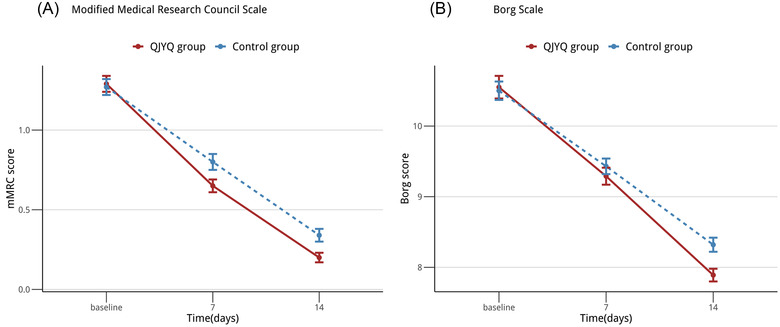
FIGURE 2.

Line chart: primary outcomes. (A) The changes of modified Medical Research Council (mMRC) scale , from baseline to 14 days. (B) The changes of Borg scale, from baseline to 14 days. All data were expressed as mean ± standard error of the mean; n = 194 per group
