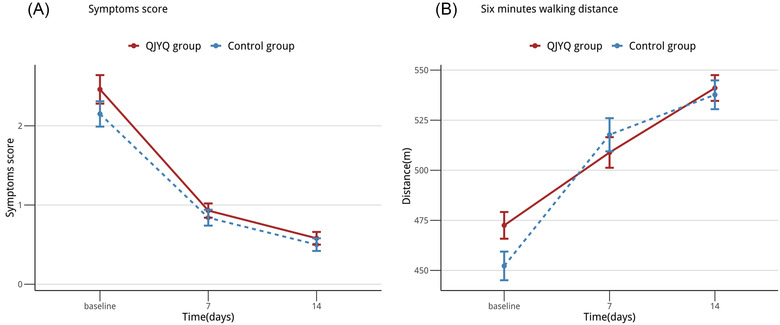
FIGURE 3.

Line chart: secondary outcomes. (A) The changes of symptoms score, from baseline to 14 days. (B) The changes of 6‐minute walking distance (6MWD), from baseline to 14 days. All data were expressed as means ± standard error of the mean; n = 194 per group
