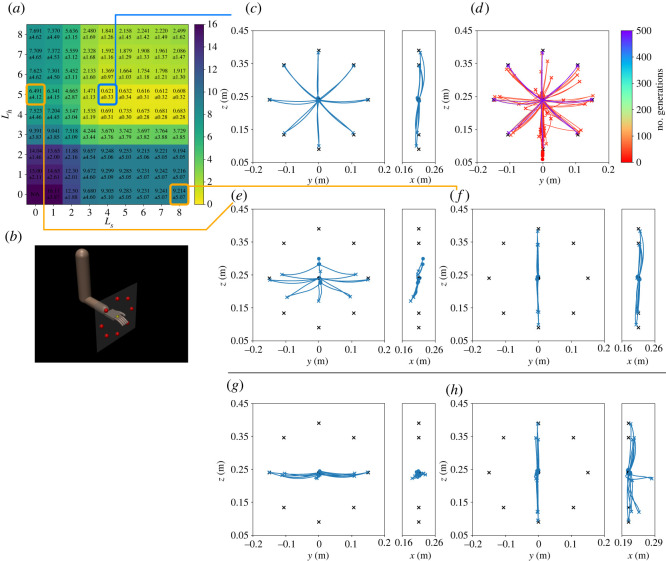
Figure 5.
Optimization results in the frontal targets (new targets). (a) Error map in (cm). (b) Frontal targets. (c) Trajectories when Lh = 5 and Ls = 4. (d) Learning progress. Trajectories at the 0, 10, 20, 30, 40, 50, 100, 150, 200, 300, 400 and 500th generations are shown. (e) Trajectories when Lh = 5 and Ls = 0. (f) Trajectories when Lh = 0 and Ls = 8. (g) Trajectories by the horizontal policy. (h) Trajectories by the sagittal policy.

