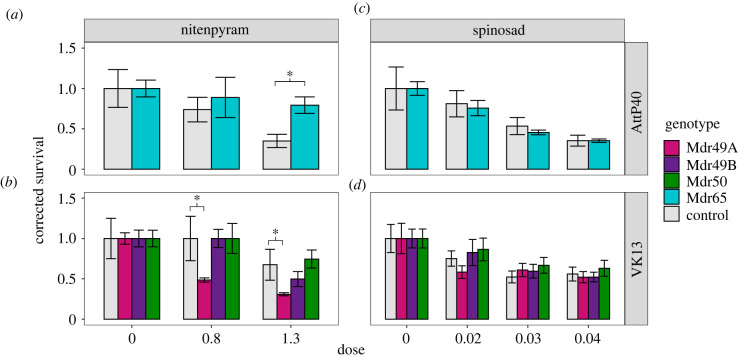
Figure 3.
Global overexpression of P-gp paralogues. Bioassay data are shown for the pesticides spinosad (c,d) and nitenpyram (a,b), the latter chosen due to the difficulty of scoring fipronil toxicology in this genetic background. As the Mdr65 overexpression genotype was generated in a distinct background it was considered separately (a,b), while all other overexpression constructs were analysed jointly (c,d). In each panel the y-axis represents survival while the x-axis signifies the dose of the pesticide under investigation. (Online version in colour.)

