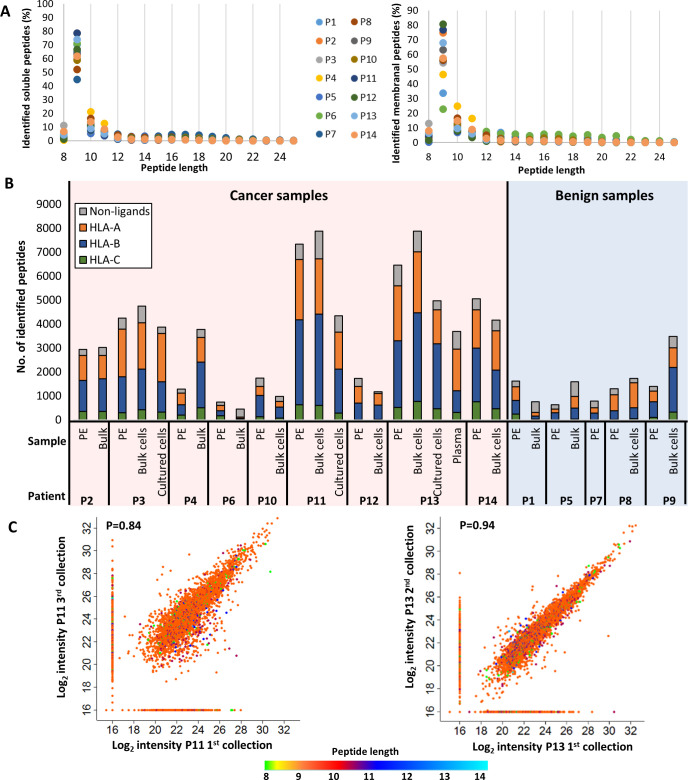
Figure 3.
Characterization of the identified HLA peptidome. (A) Length distributions of the peptides identified in the pleural fluids (left) and bulk cells (right) of all patients. The different colors of the circles represent different patients. The percentages were calculated for each length before data filtration. (B) Distribution of the HLA peptides to their presenting allotypes. The gray color represents the peptides that are either unassigned to a specific HLA allele by NetMHCpan V.4.1, are known contaminants in MaxQuant, and/or are longer than 14 amino acids. The colorful bars indicate the number of ligands attributed to HLA-A, HLA-B or HLA-C, in orange, blue or green, respectively, according to NetMHCpan V.4.1. (C) Scatter plots of log2 liquid chromatography-mass spectrometry (LC-MS) intensities of peptides identified from different pleural effusions samples of Patients 11 (left) and 13 (right). The dot colors indicate the peptides length. Pearson correlation value is indicated in each graph. HLA, human leucocyte antigen.

