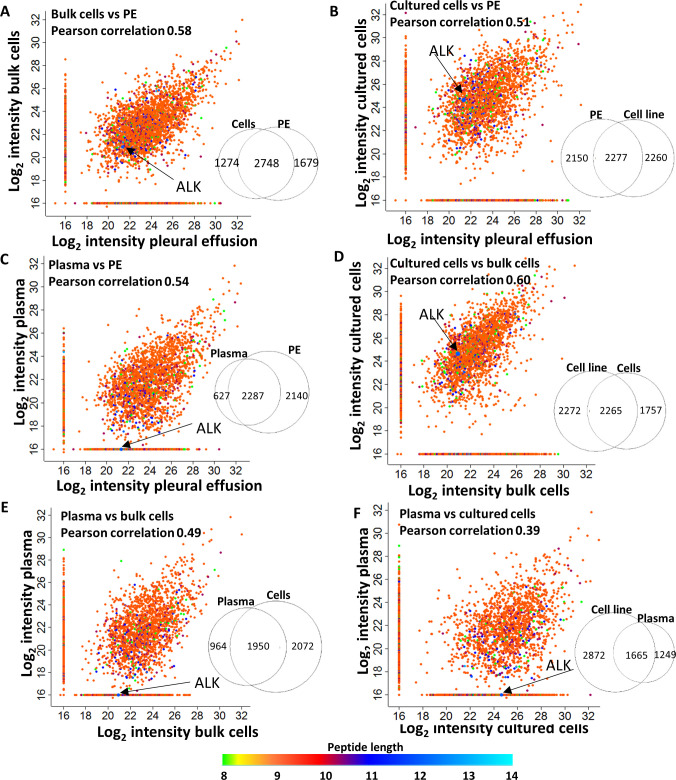
Figure 4.
The intensities of the peptides identified in the pleural effusion, bulk cells, cultured cells, and plasma of Patient 13, are correlated to each other. Scatter plots of the log2 LC-MS intensities of the peptides, identified from different sources, are shown. The colors represent the peptide length. Venn diagrams near each plot indicate the number of peptides identified in each sample. Arrows point to the intensities of the peptide MPYPSKSNQEVL, originating from anaplastic lymphoma kinase (ALK). Pearson correlations are indicated in each graph. LC-MS, liquid chromatography and mass spectrometry.

