
Figure 2.
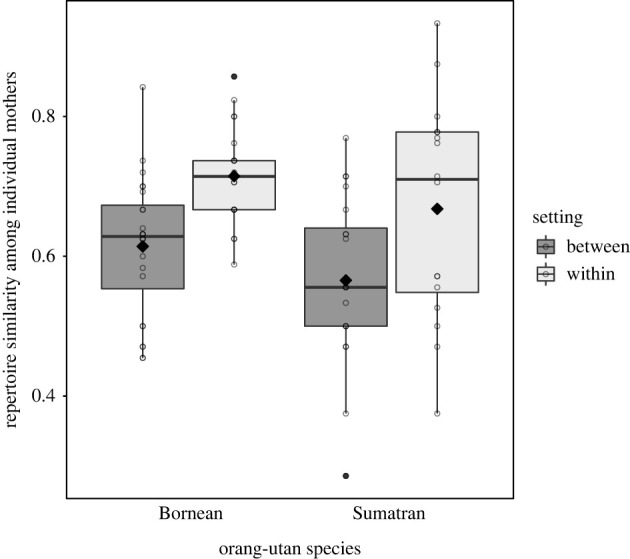
Repertoire similarity between pairs of mothers living in different (between) and the same (within) research settings, separately for each orang-utan species. Indicated are dyadic Dice coefficients (circles), population means (filled diamonds), medians (horizontal lines), quartiles (boxes), percentiles (2.5% and 97.5%, vertical lines) and outliers (filled dots). Individuals may have contributed to multiple data points. (Online version in colour.)