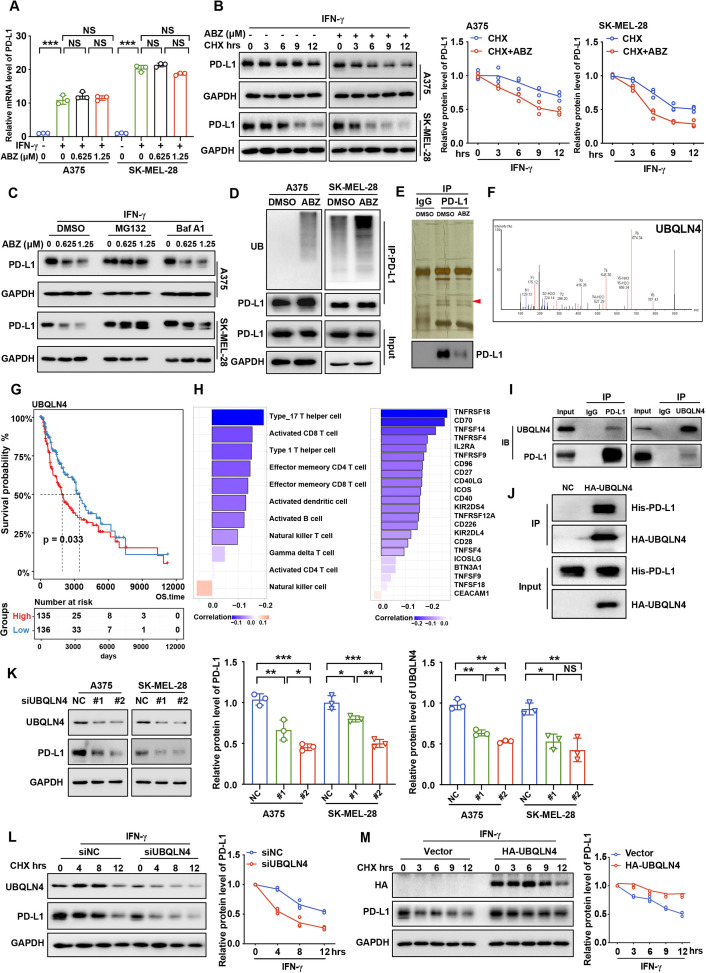
Figure 2.
ABZ decreases UBQLN4 and induces PD-L1 ubiquitin-mediated degradation. (A) Bar graph presentation of PD-L1 mRNA levels as determined by qRT-PCR of increasing concentrations of ABZ (0.625–1.25 µM) treatment of A375 and SK-MEL-28 cells for 24 hours under IFN-γ exposure, each bar represents the mean±SD of three independent experiments, NSP >0.05, ***p<0.001. (B) A375 and SK-MEL-28 cells were treated with ABZ (1.25 µM) for 24 hours under IFN-γ exposure then treated with CHX (200 ng/mL), and collected at the indicated times for western blotting. Line graph presentation of quantitative analysis of PD-L1 protein expression in A375 and SK-MEL-28 cells. (C) A375 and SK-MEL-28 cells were pretreated with increasing concentrations of ABZ (0.625–1.25 µM), then treated with Baf A1 (100 nM) and MG132 (10 µM) for 6 hour and the PD-L1 protein level were detected by western blotting. (D) A375 and SK-MEL-28 cells were treated with ABZ (1.25 µM) for 24 hours under IFN-γ exposure then treated with MG132 (10 µM) for 6 hours before harvest. PD-L1 was immunoprecipitated with an anti-PD-L1 antibody, and the immunoprecipitates were probed with an anti-ubiquitin (UB) antibody. (E) Immunoprecipitates from A375 cells treated with ABZ (1.25 µM) or DMSO were separated by SDS-PAGE and the immunoprecipitates were probed with anti-PD-L1 antibody and stained with colloidal silver to visualize proteins, respectively. The proteins pointed by the arrow were analyzed by LC/MS-MS. (F) Peptide enrichment fingerprints of UBQLB4 from LC/MS-MS QSTAR analysis. (G) Kaplan-Meier estimates for overall survival; patients from TCGA SKCM cohort were stratified into two groups based on the median expression level of UBQLN4. Significance was determined by the log-rank test. (H) Significantly correlation between UBQLN4 expression level and infiltration of activated immune cell (left panel) or expression level of activated checkpoints (right panel) in TCGA SKCM cohort, respectively. Spearman’s correlation test was performed, black border, *p<0.05. (I) A375 cell lysates were subjected to immunoprecipitation with control IgG, anti-PD-L1 or anti-UBQLN4 antibodies. The immunoprecipitates were then probed with anti-UBQLN4 or anti-PD-L1 antibody, respectively. (J) Representative western blotting analysis of pull-down of purified HA-UBQLN4 with purified His-PD-L1. (K) Representative western blotting and quantitative analysis of UBQLN4 and PD-L1 proteins expression when knockdown UBQLN4 in A375 and SK-MEL-28 cells under IFN-γ exposure, each bar represents the mean±SDof three independent experiments, NSP >0.05, *p<0.05, **p<0.01, ***p<0.001. (L) A375 cells transfected with control or UBQLN4 siRNA were treated with CHX (200 ng/mL) and collected at the indicated times for western blotting. Line graph presentation of quantitative analysis of PD-L1 protein level. (M) A375 cells transfected with a vector expressing HA-UBQLN4 and an empty vector were treated with CHX (200 ng/mL) and collected at the indicated times for western blotting. Line graph presentation of quantitative analysis of PD-L1 protein level, GAPDH was used as the loading control. ABZ, albendazole; IFN-γ, Interferon gamma; CHX, cycloheximide; LC/MS-MS, liquid chromatography tandem mass spectrometry; GAPDH, glyceraldehyde-3-phosphate dehydrogenase.

