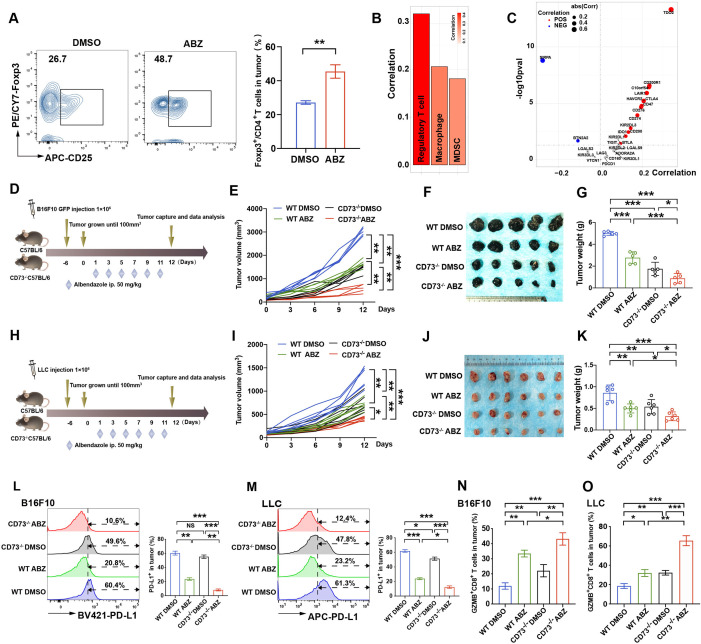
Figure 4.
Genetic deletion of CD73 enhanced ABZ-mediated immunotherapy response in vivo. (A) Representative profiles and quantification of flow cytometry-based detection of the Foxp3+CD4+ TILs in B16F10 tumor mass from the different treatment groups (n=5 mice per group, **p<0.01). (B, C) Significantly correlation for suppressive immune cell types or inhibitory immune checkpoints and CD73 expression level in TCGA SKCM cohort. Spearman’s correlation test was performed. Bars with black border, *p<0.05. Points in the scatter plot represent positive (RS >0 and pvalue <0.05, in red), negative (RS <0 and pvalue <0.05, in blue), or non-significant correlation (in gray). (D–G) CD73 WT and KO mice (n=5 mice per group) were implanted with 1×10⁶ WT B16F10 and received 50 mg/kg of ABZ treatment as the chart indicated. (D) a schematic view of the treatment plan. (E) Tumor volume was measured on the indicated different time points (n=5 mice per group). Data represent mean±SD, **p<0.01, ***p<0.001. (F) Photographs of representative tumors harvested from CD73 WT and KO mice after ABZ treatment at day 12. (G) Tumor weight was measured on day 12. Data represent mean±SD, *p<0.05, ***p<0.001. (H–K) CD73 WT and KO mice (n=6 mice per group) were implanted with 1×10⁶ WT LLC and received 50 mg/kg of ABZ treatment as the chart indicated. (H) A schematic view of the treatment plan. (I)Tumor volume was measured on the indicated different time points (n=6 mice per group). Data represent mean±SD, *p<0.05, **p<0.01, ***p<0.001. (J) Photographs of representative tumors harvested from CD73 WT and KO mice after ABZ treatment at day 12. (K) Tumor weight was measured on day 12. Data represent mean±SD, *p<0.05, **p<0.01, ***p<0.001. (L, M) representative profiles and quantification of flow cytometry-based detection of the PD-L1 from B16F10 (L) and LLC (M) tumor mass (n=5 mice per group). Data represent mean±SD, NSP >0.05, **p<0.01, ***p<0.001. (N, O) quantification of flow cytometry-based detection of the GZMB+ CD8+ in CD3+ TILs from B16F10 (N) and LLC (O) tumor mass (n=5 mice per group). Data represent mean±SD, *p<0.05, **p<0.01, ***p<0.001. ABZ, albendazole;TILs, tumor infiltrates lymphocytes; LLC, Lewis lung cancer.

