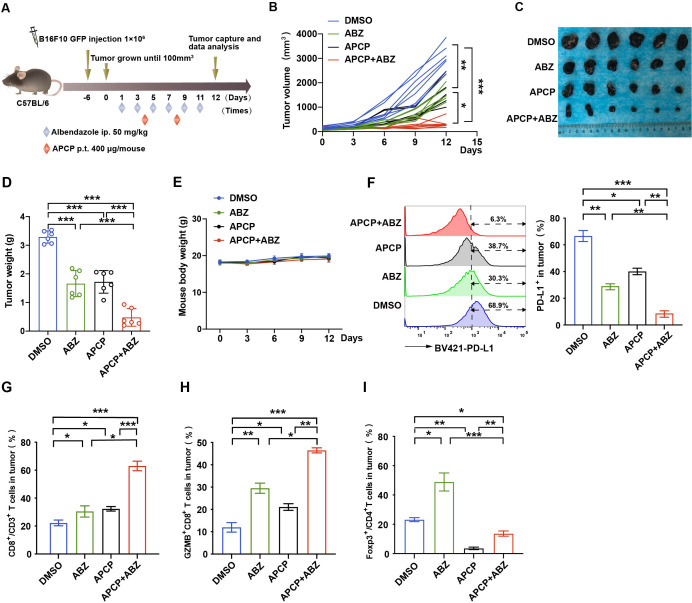
Figure 5.
Synergistic effect of CD73 specific inhibitor and ABZ therapy in the melanoma mouse model. (A) Mouse melanoma cell line B16F10 cells were injected into mice (n=6 mice per group) on day −6, ABZ (50 mg/kg) and APCP (400 µg/mouse) were administered alone or together as the chart indicated. (B) Tumor volume was measured on the indicated different time points (n=6 mice per group). Data represent mean±SD, *p<0.05, **p<0.01, ***p<0.001. (C) Photographs of representative tumors after ABZ and APCP treatment on day 12 in the B16F10 tumor burden mouse model. (D) Tumor weight was measured on day 12. Data represent mean±SD, ***p<0.001. (E) Mice weight was measured on the indicated different time points. (F) Representative profiles and quantification of flow cytometry-based detection of the PD-L1 from B16F10 tumor mass (n=6 mice per group). Data represent mean±SD, *p<0.05, **p<0.01, ***p<0.001. (G) Representative profiles and quantification of flow cytometry-based detection of the CD8+ in CD3+ TILs in B16F10 tumor mass from the different treatment groups (n=6 mice per group). Data represent mean±SD, *p<0.05, ***p<0.001. (H) Representative profiles and quantification of flow cytometry-based detection of the GZMB+ CD8+ in CD3+ TILs from the B16F10 tumor mass (n=6 mice per group). Data represent mean±SD, *p<0.05, **p<0.01, ***p<0.001. (I) Representative profiles and quantification of flow cytometry-based detection of the Foxp3+ in CD4+ TILs in B16F10 tumor mass from the different treatment groups (n=6 mice per group). Data represent mean±SD, *p<0.05, **p<0.01, ***p<0.001. ABZ, albendazole; APCP, adenosine 5'-(α,β-methylene) diphosphate; TILs, tumor infiltrates lymphocytes.

