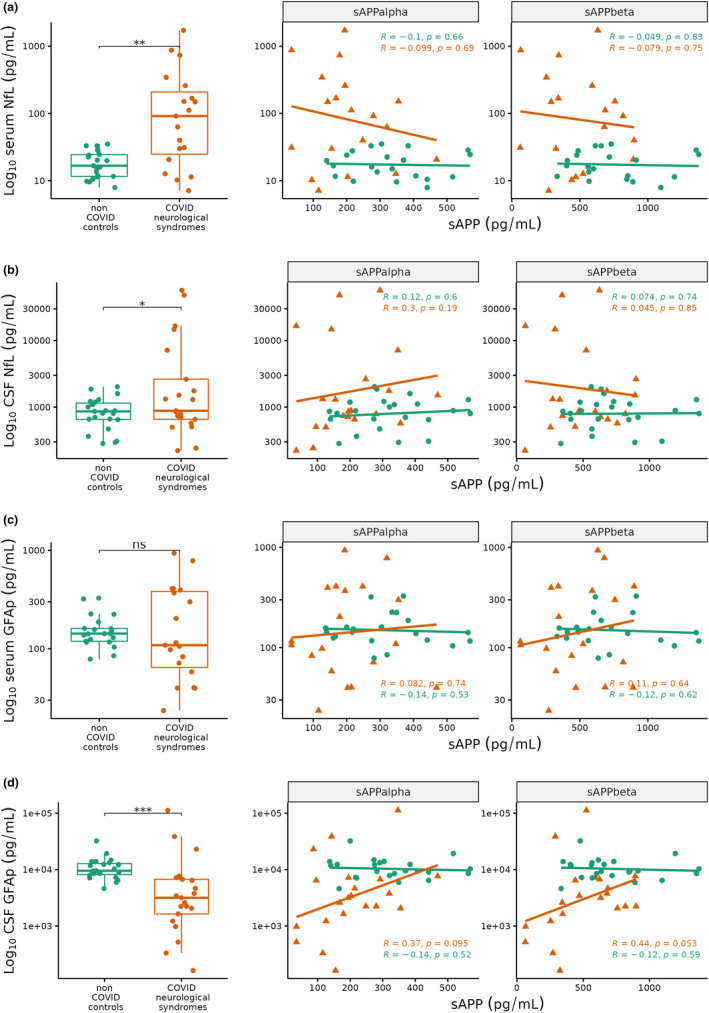
FIGURE 2.

Boxplots (left) and scatterplots (right) of (a) serum neurofilament light (NfL), (b) cerebrospinal fluid (CSF) NfL, (c) serum glial fibrillary acidic protein (GFAp), (d) CSF GFAp in COVID neurological syndromes (red, n = 21) and non‐COVID controls (green, n = 23). Scatterplots show soluble amyloid precursor protein (sAPP) ɑ (left facet) and sAPPβ (right facet) on x‐axis against Log10 NfL and GFAp (y‐axis). Correlation coefficients and p‐values are shown in each scatterplot for non‐COVID controls (green), COVID neurological patients (red). Wilcoxon test *p < 0.05, **<0.01, ***<0.001, ns, non‐significant
