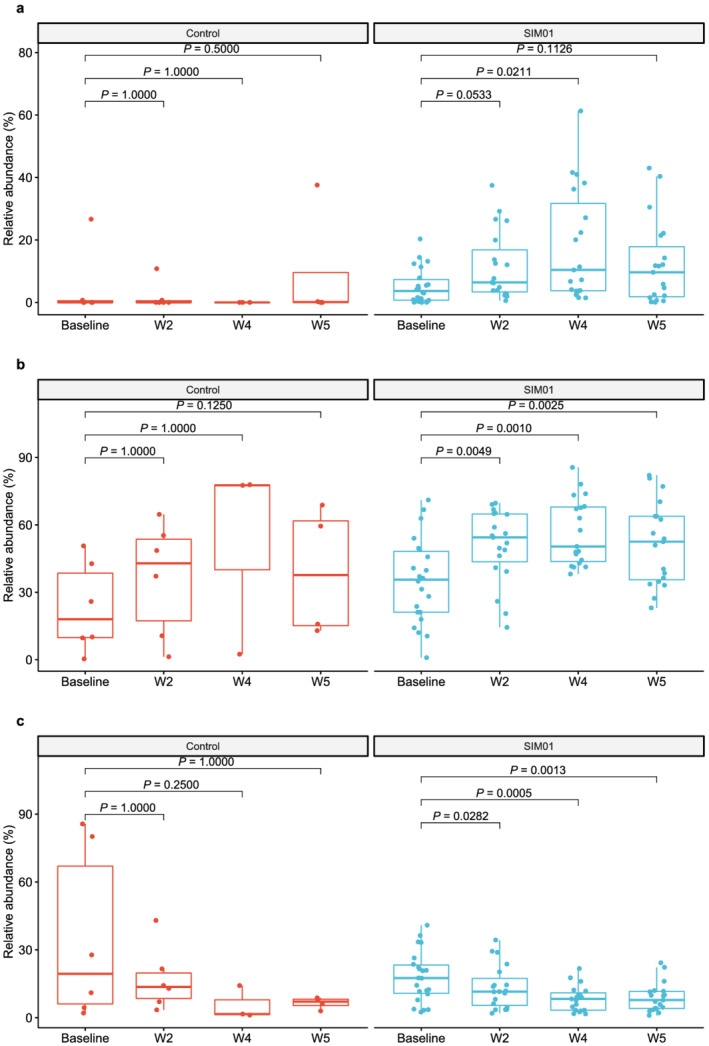
Figure 3.

(a) Relative abundance of three probiotic species contained in SIM01 as an aggregate at baseline, week 2, week 4 and week 5 in the SIM01 and control groups. (b) Relative abundance of bacteria species known to be depleted in COVID‐19 patients at baseline, week 2, week 4 and week 5 in the SIM01 and controls groups. (c) Relative abundance of bacteria species known to be enriched in COVID‐19 patients at baseline, week 2, week 4 and week 5 in SIM01 and control groups. P values were determined by Friedman test, Post‐hoc: Wilcoxon signed‐rank test with Bonferroni correction. [Color figure can be viewed at wileyonlinelibrary.com]
