
Figure 4.
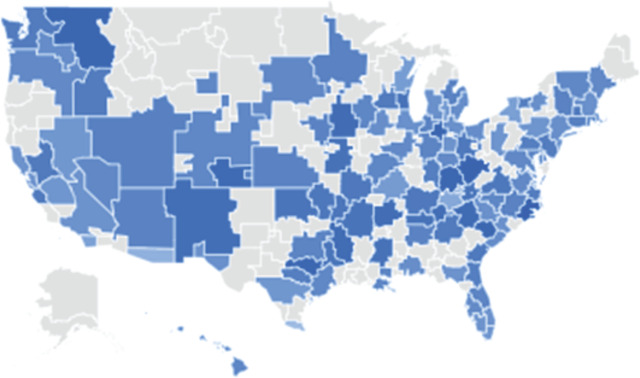
Search Volume Index by Metro Area for Home Birth in the United States During the Weeks of March 17, 2019 to February 14, 2021
Darker colors represent higher search volume index scores. The Metro areas with no color denote very low level of interest. Data source: Google Trends (https://www.google.com/trends). Accessed February 21, 2021.