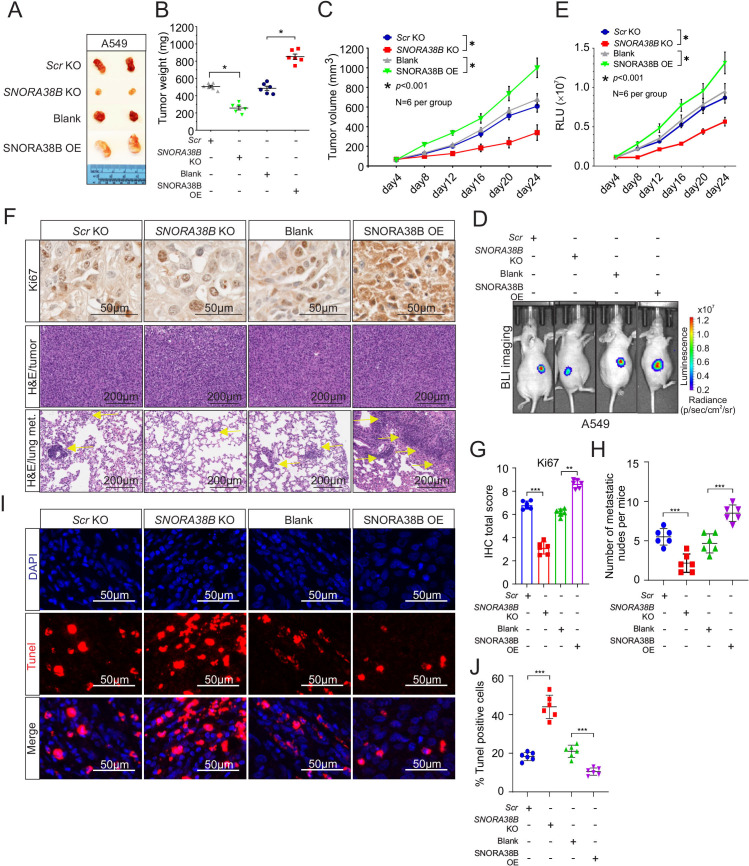
Figure 2.
SNORA38B accelerated tumor growth and metastasis in vivo. (A) Representative image of SNORA38B KO/ SNORA38B OE A549 xenograft tumors separated from nude mice. (B) Tumor weight of separated tumors, n=6 per group. (C) Tumor volume measured every 4 days using caliper (for L and W) and calculated according to formula 0.5×L×W2. n=6 per group. (D–E) Representative images and quantification of BLI in the luciferase reporter gene labeled A549 tumor regions. BLI was examined every 4 days before reaching the observation endpoint. n=6 per group. (F) Representative images of immunohistochemistry staining for Ki67, and H&E staining in tumor region and metastases. The arrows point to the lung metastatic nodule. Bar=50/200 µm. (G) Quantitative results of Ki-67 detection assay. (H) Numbers of lung metastasis per mice. (I–J) Representative results of Terminal deoxyribonucleotide transferase-mediated dUTP nick end labeling assay using tumor tissue sections separated from nude mice. Bar=50 µm. Assays were conducted in triplicate. *p<0.05, **p<0.01, ***p<0.001. Means±SD was shown. Statistical analysis was subjected to one-way analysis of variance. Comparison between-group (SNORA38B KO and Scr KO, SNORA38B OE and vector OE) using LSD method. BLI, bioluminescence imaging; KO, knockout; OE, overexpress; SNORNA, small nucleolar RNA; RLU, relative light units; LSD, the Fisher Least Significant Difference.

