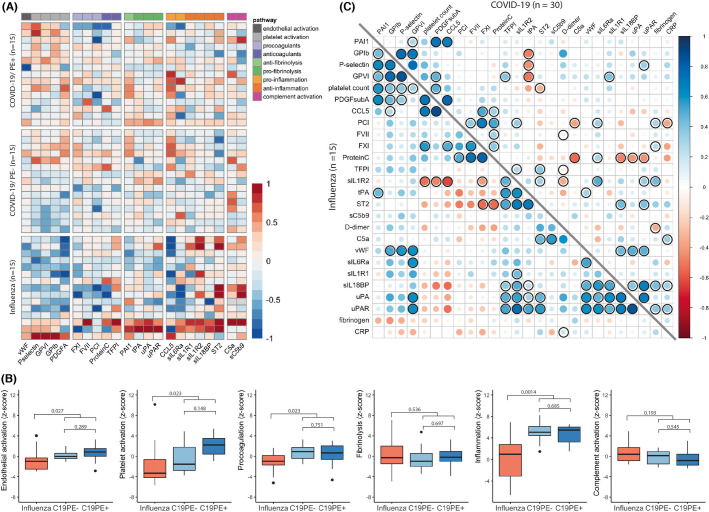
FIGURE 2.
Levels of individual biomarkers and pathway activity at timepoint 1. (A) Heatmap of protein expression of biomarkers at t1. Light grey colored boxes represent missing data. Protein expression of all biomarkers besides C5a and sC5b‐9 was measured using proximity extension assay. Plasma concentrations of C5a and sC5b‐9 were measured using ELISA assays. (B) Summed z‐scores for thrombosis pathways at t1. Z‐scores of all biomarkers involved per thrombosis pathway (as specified in A) were summed, after sign‐inversion for biomarkers having a pathway‐inhibiting function. For endothelial activation, z‐scores for both vWF and P‐selectin were used. Differences between influenza, C19PE‐ and C19PE+ were tested using a Wilcoxon‐signed rank test. Differences between influenza and all COVID‐19 patients (i.e., C19PE+ and C19PE‐ combined) were tested using a Mann‐Whitney U test. p‐values were false discovery rate corrected. (C) Correlation matrix for the measured biomarkers, D‐dimer, fibrinogen, platelet count and CRP, at t1. Spearman correlation with false discovery rate correction was used to test significance of correlations. Correlations with FDR corrected p‐values <.05 are marked. PE+ = patients who developed pulmonary embolism, PE‐ = patients who did not develop pulmonary embolism

