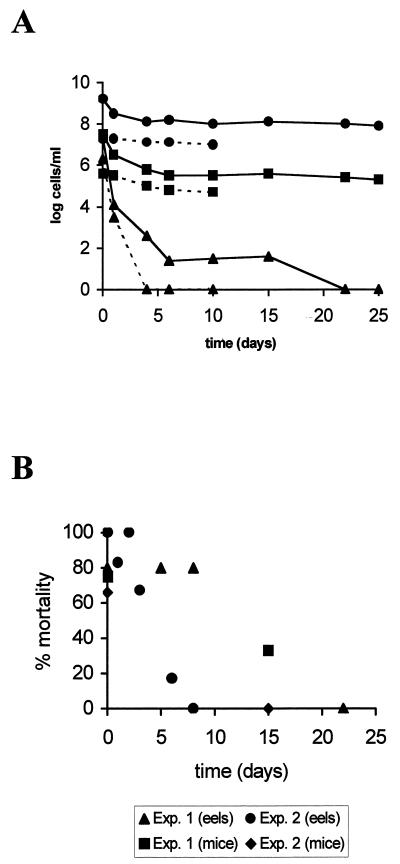
FIG. 3.
(A) Starvation-survival response of strain E22 in microcosms of 0% salinity maintained at 25°C. Shown are the results, from experiment 1 (——) and experiment 2 (–––), of plate counts on MSWYE agar (▴), direct viable counts obtained by the method of Kogure et al. (25) (■), and acridine orange direct counts (●). Each point represents the average of values from two different experiments. (B) Eel and mouse mortalities after the injection of 0.1 and 0.2 ml, respectively, of microcosm. Exp., experiment.

