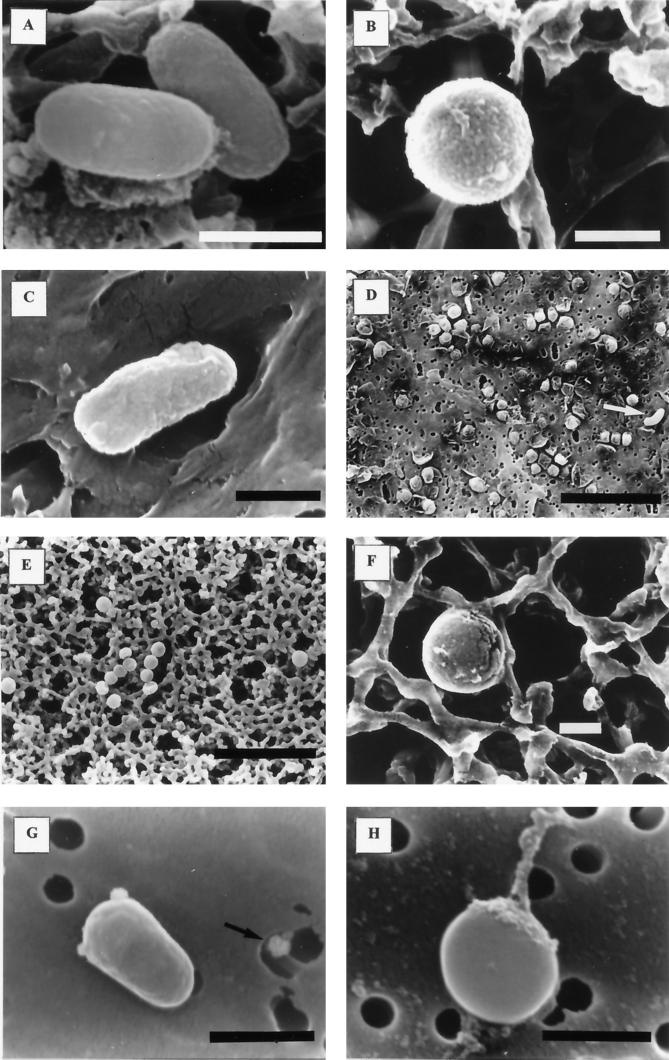
FIG. 6.
Electron micrographs of control and starved cells. (A) Cells at time zero. (B) Cell from a microcosm at 0.3% salinity, after 7 days of starvation. (C) Cell from a microcosm of 3.8% salinity, after 2 years of starvation. (D) Sample from a microcosm of 0.3% salinity, after 2 years of starvation, showing cell debris and a single cell (marked by an arrow). (E) Sample from a microcosm of 0% salinity, after 7 days of starvation, showing collapsed cells. (F) Cell from a microcosm of 0% salinity, after 7 days of starvation, showing external fissures. (G) Sample from a microcosm of 3.8% salinity, after 7 months of starvation, showing one cell with two adherent vesicles and one liberated vesicle (marked by an arrow). (H) Cell from a microcosm of 3.8% salinity, after 1 year of starvation, showing adherent extracellular material. Millipore filters (A, B, E, and F) and Nuclepore filters (Nuclepore Corp., Pleasanton, Calif.) (C, D, G, and H) were used in these studies. Bars, 0.5 μm (A, B, C, F, G, and H) or 5 μm (D and E).

