FIGURE 2.

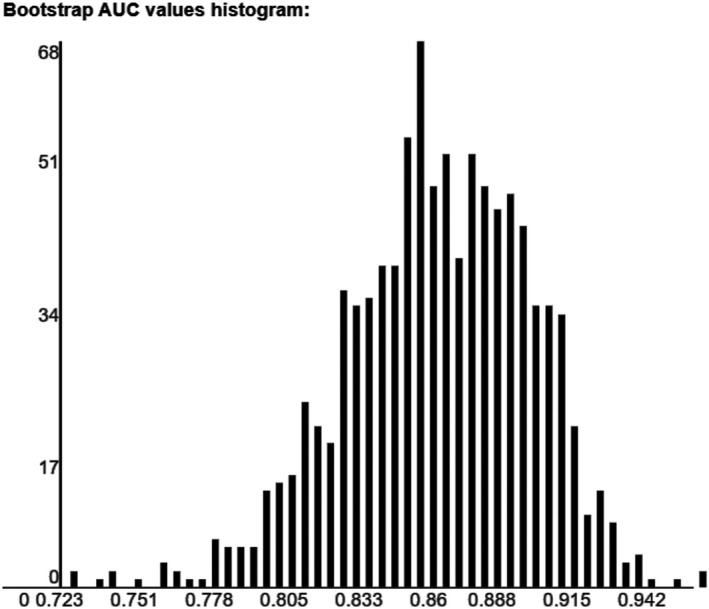
Histogram of distribution of area under the receiver operator curve (AUC) of 1000 bootstrapped samples. The optimism estimated was 0.047, with a corrected AUC of 0.854 (95% CI 0.77–0.92)

Histogram of distribution of area under the receiver operator curve (AUC) of 1000 bootstrapped samples. The optimism estimated was 0.047, with a corrected AUC of 0.854 (95% CI 0.77–0.92)