FIGURE 3.

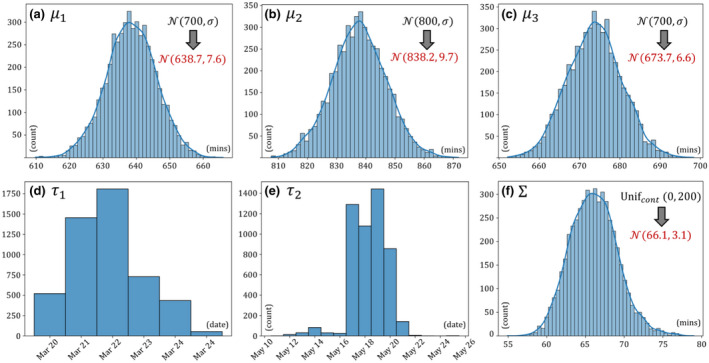
Posterior distribution of changepoints ( and ), stage mean values (, , and ), and standard deviation () in the general model setting [Equation (6)] for home‐dwelling records at the U.S. national level

Posterior distribution of changepoints ( and ), stage mean values (, , and ), and standard deviation () in the general model setting [Equation (6)] for home‐dwelling records at the U.S. national level