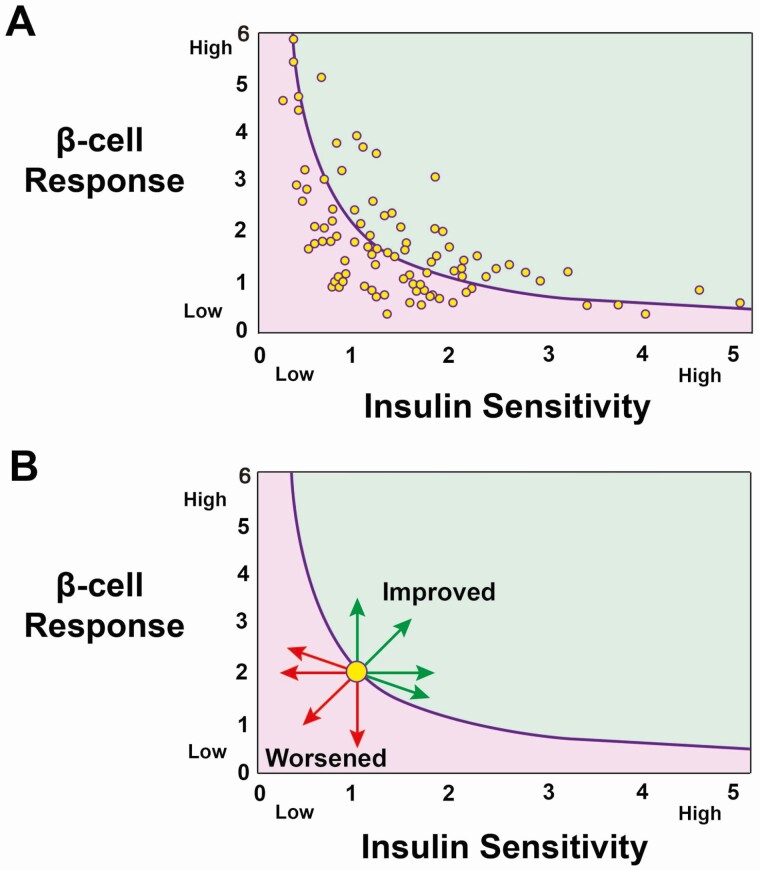
Figure 6.
Schematics illustrating the relationship between insulin sensitivity and β-cell responses as determinants of β-cell function. A, The relationship is nonlinear in nature and defines a hyperbola with insulin resistant individuals having greater β-cell responses than individuals who are insulin sensitive. The heterogeneity of this relationship among people is demonstrated by individuals falling on either side of the line. The line depicts the mean relationship of insulin sensitivity and the β-cell response for these individuals, commonly known as the disposition index, representing β-cell function. If the slope describing the relationship between these 2 variables is not statistically different from −1, the disposition index can be calculated as the simple product of insulin sensitivity and the β-cell response. The area above the line typically represents better glucose tolerance and below the line poorer glucose tolerance. B, Vector plot of the longitudinal effects of intervention(s) on insulin sensitivity and β-cell responses in individuals or groups of individuals. Any change that moves from the starting point to above the line (even if the β-cell response is lower) represents an improvement in β-cell function, while changes that result in the endpoint being below the line (even if the β-cell response is greater) represent a worsening of β-cell function. Movement along the line, whether it be up or down, represents changes in insulin sensitivity and β-cell responses, but not a change in β-cell function (not illustrated).

