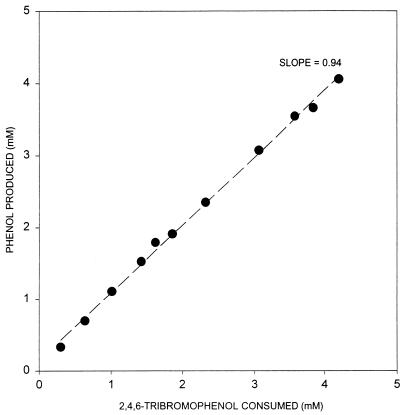
FIG. 4.
Stoichiometric dehalogenation of 2,4,6-TBP to phenol by strain TBP-1. Dotted line represents the regression line of the average cumulative 2,4,6-TBP consumed by duplicate cultures plotted against the average cumulative phenol produced. Stoichiometric phenol production demonstrates that dehalogenation of 2,4,6-TBP was complete and that no phenol was consumed by or lost from these cultures.

